
FIGURE
Fig. 3
- ID
- ZDB-FIG-230723-25
- Publication
- Shainer et al., 2023 - A single-cell resolution gene expression atlas of the larval zebrafish brain
- Other Figures
- All Figure Page
- Back to All Figure Page
Fig. 3
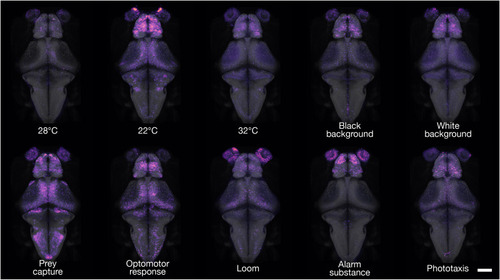
cfos brain activity maps of freely swimming fish.
3D projections of cfos FISH-labeled areas of neuronal activity during behavior. Dorsal views are shown for each experimental condition. For interactive viewing, spanning the full depth of the brain, see mapzebrain atlas at https://mapzebrain.org/. Scale bar, 100 μm. |
Expression Data
Expression Detail
Antibody Labeling
Phenotype Data
Phenotype Detail
Acknowledgments
This image is the copyrighted work of the attributed author or publisher, and
ZFIN has permission only to display this image to its users.
Additional permissions should be obtained from the applicable author or publisher of the image.
Full text @ Sci Adv