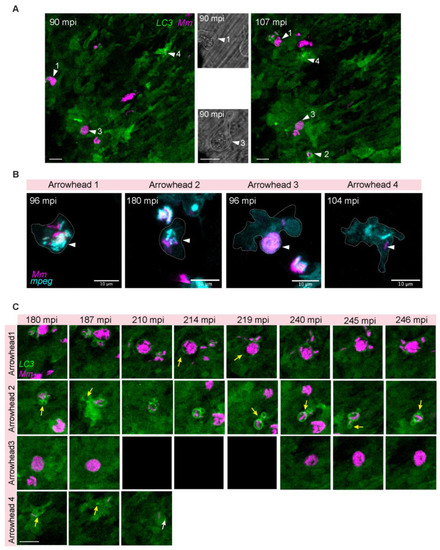
Intracellular dynamics of LC3 association with Mm. Double transgenic (mpeg1.1:mCherry-F/CMV:GFP-LC3 zebrafish larvae, labeling macrophages (pseudo color cyan) and LC3 autophagy-related protein (green), were infected with 100 CFU of E2-crimson Mm (pseudo color magenta) following the TFI protocol. (A) Maximum projection of the entire time-lapse field of view of the injected area (Supplementary Video S4). At 90 mpi, LC3-positive, large (arrowhead 1), and small (arrowheads 2 and 4) Mm clusters are observed. At 107 mpi, an additional LC3-positive Mm cluster is within the field of view (arrowhead 2). The corresponding bright field (BF) images of 90 mpi show magnifications of the cells with intracellular clusters of bacteria, indicated by arrowheads 1 and 3. Cellular borders are outlined with dashed lines. (B) Zoomed-in areas corresponding to the arrowheads in A showing the mpeg1.1:mCherry-F signal (pseudo color cyan) to confirm the localization of Mm inside macrophages (C) Time series of zoomed-in areas corresponding to the arrowheads in A. Arrowhead 1 displays LC3-positive spacious containing a large Mm cluster, dynamically interacting with LC3-positive empty vesicles (yellow arrows). Arrowhead 2, LC3-positive compound vesicles associated with a small Mm cluster and undergoing vesicle fusion (yellow arrows 180–187 mpi). Arrowhead 3 points at an LC3-negative large Mm cluster that is observed over the entire time-lapse duration without any variation in size or distribution inside the cell compartments (the cell was out of focus due to adjustment of the tissue between 210–219 min)). Arrowhead 4, Compact Mm-containing vesicle inside a highly motile cell in close association with LC3 signal. LC3 bright puncta (white arrow) and tubular (yellow arrow) structures are adjacent to the bacteria. Scale bar: 10 μm.
|
