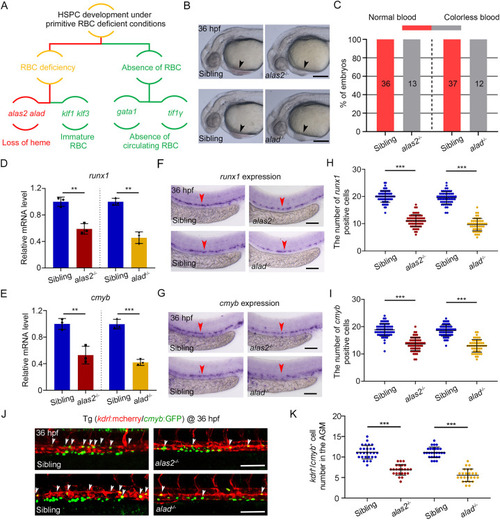
HSPC formation is impaired in alas2- and alad-deficient embryos. (A) Screening strategy of HSPC development under different primitive RBC-deficient conditions. (B) Bright-field images of blood flow in alas2−/−, alad−/− and their siblings at 36 hpf. Blood flow in heart regions is denoted by arrowheads. (C) Cumulative results of blood color phenotype in B. Number of embryos with different blood color are noted in each column. (D,E) Relative mRNA level of runx1 (D) and cmyb (E) in the dissected trunk regions of alas2−/−, alad−/− and their sibling at 36 hpf examined by qRT-PCR. n=3 experimental replicates. (F,G) Expression of runx1 and cmyb in alas2−/−, alad−/− and their sibling at 36 hpf examined by WISH. The AGM regions for marker gene-positive cell counting are denoted by red arrowheads. (H,I) Quantification of the runx1- and cmyb-positive HSPCs in F and G. n=3 experimental replicates. (J) Confocal imaging shows the kdrl+/cmyb+ HSPCs in AGM regions of alas2−/−, alad−/− and their siblings at 36 hpf. The kdrl+/cmyb+ HSPCs in the AGM region are denoted by white arrowheads. (K) Quantification of the indicated cells in confocal imaging. n=3 experimental replicates. Number of samples are indicated. Data are mean±s.d. **P<0.01; ***P<0.001 [Mann–Whitney non-parametric U-test (D,E); one-way ANOVA, Tukey's multiple comparisons (H,I,K)]. n.s., not significant. Scale bars: 200 μm (B); 100 μm (F,G,J).
|
