
Figure 7
- ID
- ZDB-FIG-230526-36
- Publication
- Zeng et al., 2023 - Loss of threonyl-tRNA synthetase-like protein Tarsl2 has little impact on protein synthesis but affects mouse development
- Other Figures
- All Figure Page
- Back to All Figure Page
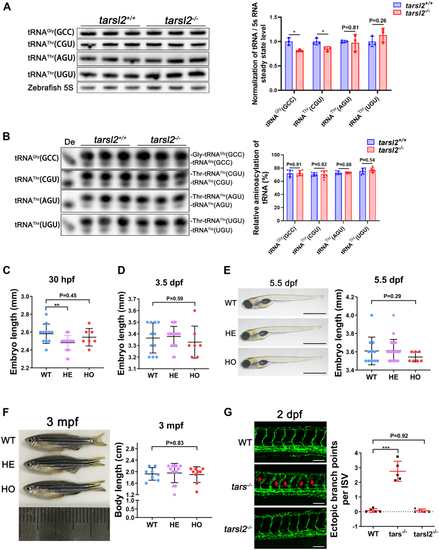
The tarsl2-null zebrafish display a normal phenotype.A, levels of tRNA Gly(GCC), tRNAThr(CGU), tRNAThr(AGU), and tRNAThr(UGU) in WT and tarsl2−/− zebrafish embryos, with quantification shown on the right. Zebrafish 5S RNA was included as the loading control. B, aminoacylation levels of tRNAGly(GCC), tRNAThr(CGU), tRNAThr(AGU), and tRNAThr(UGU) in WT and tarsl2−/− zebrafish embryos, with the quantification analysis results shown on the right. De: tRNA deaminoacylation control. C and D, quantification analysis showing the body length of the WT, tarsl2+/− and tarsl2−/− embryos 30 hpf (C) and 3 dpf (D). E, images showing the body length of the WT, tarsl2+/− and tarsl2−/− embryos 5.5 dpf on the left, with quantification analysis shown on the right. The scale bar reprents 1 mm. F, representative images (left) and quantification (right) results showing the body length of the WT, tarsl2+/− and tarsl2−/− zebrafish 3 mpf. G, representative confocal microscopy images (left) and quantification analysis (right) of the ectopic branch points per ISV of the WT, tars−/− and tarsl2−/− embryos two dpf. The scale bar represents 100 μm. ∗∗p < 0.01 and ∗∗∗p < 0.001. The error bar represents the mean ± SD with the p values indicated (two-tailed Student’s t test). |