
Figure 5
- ID
- ZDB-FIG-230518-57
- Publication
- Martin et al., 2023 - Nr2f1a maintains atrial nkx2.5 expression to repress pacemaker identity within venous atrial cardiomyocytes of zebrafish
- Other Figures
- All Figure Page
- Back to All Figure Page
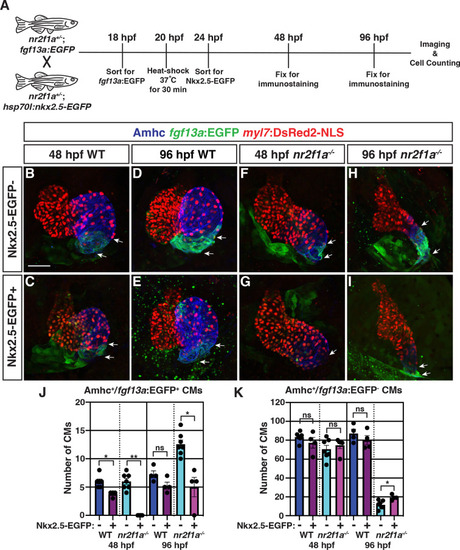
(A) Schematic of timeline for heat-shock experiments. (B–I) IHC of representative hearts for Amhc (blue), fgf13a:EGFP (green), and myl7:DsRed2-NLS (red) used to quantify Amhc+/fgf13a:EGFP+ cardiomyocytes (CMs) marking PCs from wild-type (WT) and nr2f1a mutant embryos with and without Nkx2.5-EGFP. White arrows indicate boundaries of Tg(fgf13a:EGFP) expression. Scale bar indicates 50 μm. (J–K) Quantification of Amhc+/fgf13a:EGFP+/myl7:DsRed2-NLS+ (PCs) and Amhc+/fgf13a:EGFP-/myl7:DsRed2-NLS+ cardiomyocytes in the atria with and without Nkx2.5-EGFP induction; 48 hpf WT: Nkx2.5-EGFP- (n=6), Nkx2.5-EGFP+ (n=4); 48 hpf nr2f1a-/-: Nkx2.5-EGFP- (n=7), Nkx2.5-EGFP+ (n=5); 96 hpf WT: Nkx2.5-EGFP- (n=4), Nkx2.5-EGFP+ (n=4); 96 hpf nr2f1a-/-: Nkx2.5-EGFP- (n=7), Nkx2.5-EGFP+ (n=4). Differences between WT and nr2f1a-/- at the different time points were analyzed using Student’s t-test. Error bars indicate s.e.m. *p=0.05–0.001, **p<0.001.
|