
Figure 3
- ID
- ZDB-FIG-230518-26
- Publication
- Tornini et al., 2023 - linc-mipep and linc-wrb encode micropeptides that regulate chromatin accessibility in vertebrate-specific neural cells
- Other Figures
- All Figure Page
- Back to All Figure Page
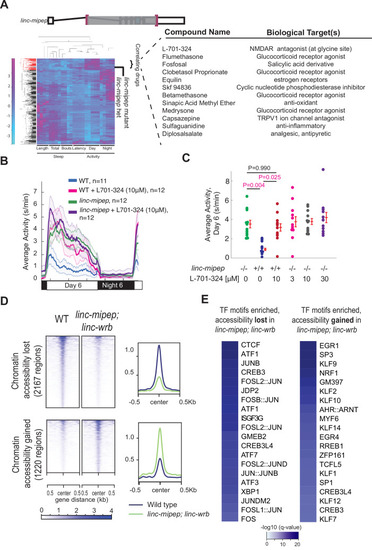
(A) Left, hierarchical clustering of the linc-mipep del-1.8kb (schematic of mutation at top) behavioral fingerprints (right), compared with the fingerprints of wild-type zebrafish larvae exposed to 550 psychoactive agents from 4 to 6 dpf (Rihel et al., 2010). The Z score, defined as the average value (in standard deviations) relative to the behavioral profiles of WT exposed to DMSO, is represented by each rectangle in the clustergram (magenta, higher than DMSO; cyan, lower than DMSO). The linc-mipep del-1.8kb fingerprint correlates with agents that induce daytime activity (‘‘Correlating Drugs’’). Right, compounds ranked according to correlation with the linc-mipep del-1.8kb fingerprint, with biological target(s) noted in last column. (B) Locomotor average activity of wild-type larvae treated with DMSO (WT, blue) or with 10μM NMDA receptor antagonist L-701,324 (magenta), and linc-mipep del-1.8kb/del-1.8kb larvae treated with DMSO (linc-mipep, green) or with 10μM L-701,324 (purple); sibling-matched larvae tracked over 24hr. (C) Average activity (day 6) of WT larvae treated with DMSO or 10μM L-701-324, compared to linc-mipepdel-1.8kb/del-1.8kb larvae treated with DMSO or 3μM, 10μM, or 30μM L-701-324. Each dot represents one fish. L-701–324 has a strong effect in the wild type animals but not in the mutants (P=0.05, DrugXGenotype interaction, two-way ANOVA). Key p-values are shown based on Tukey’s post-hoc testing. (D) Heatmaps (left) and density plots (right) showing chromatin accessibility (omni-ATAC-seq, average of three replicates) profiles of 2167 regions globally with lower accessibility in linc-mipep; linc-wrb mutant brains at 5 dpf compared to wild type (WT) brains (top), or 1220 regions globally with higher accessibility in linc-mipep; linc-wrb mutant brains at 5 dpf compared to wild type (WT) brains. Heatmaps are centered at the summit of the Omni-ATAC peak with 500bp on both sides and ranked according to global accessibility levels in WT. (E) Transcription factor (TF) motifs enriched in up-regulated and down-regulated regions (in D), relative to unaffected regions (in Figure 3—figure supplement 3).
|