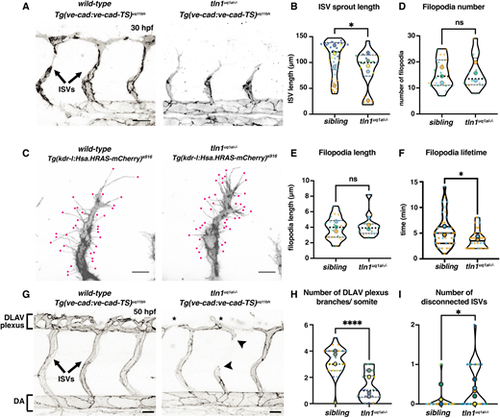
Focal adhesion function is required for efficient angiogenic sprouting and network maintenance. (A) Trunk vasculature of a Tg(ve-cad:ve-cad-TS)-positive wild-type sibling and a tln1uq1al−/− mutant embryo at 30 hpf. ISV sprouts are indicated. Scale bars: 50 µm. (B) Quantification of ISV sprout length, showing a mild reduction in mutants, n=5 replicates: n=39 ISVs in siblings and n=19 ISVs in tln1uq1al−/− mutants (*P<0.05, Mann–Whitney test). (C) High-resolution live image showing filopodial extensions at the sprouting front of an ISV in a wild-type sibling and in tln1uq1al−/− mutant embryo at 30 hpf. Embryos express Tg(kdrl:Hsa.HRAS-mCherry)s916, labelling the EC membrane. Scale bars: 10 µm. (D,E) Quantification of filopodia number (D) and length (E) at the tip of ISV sprouts, n=3 replicates: n=24 filopodia in siblings and n=12 filopodia in tln1uq1al−/− mutants, no significant difference (ns) (unpaired t-test) . (F) Lifetime (min) of filopodia at the sprouting tip. Lifetime is time between emergence and full retraction of a single filopodia, n=2 replicates: n=42 filopodia in siblings and n=30 filopodia in tln1uq1al−/− mutants (*P<0.05, Mann–Whitney test). (G) Trunk vasculature of a Tg(ve-cad:ve-cad-TS)-positive wild-type sibling and a tln1uq1al−/− mutant embryo at 50 hpf, showing reduced DLAV plexus formation (asterisks) and disconnected ISVs (arrowheads) in the mutant. Scale bars: 50 µm. (H) Quantification of the number of DLAV branches per somite, n=5 replicates: n=29 siblings and n=22 tln1uq1al−/− mutants (****P<0.0001, unpaired t-test). (I) Quantification of the number of disconnected ISVs across the width of two somites, located above the yolk extension, n=5 replicates: n=29 siblings and n=22 tln1uq1al−/− mutants (*P<0.05, Mann–Whitney test). In all graphs, replicate averages are depicted by large circles; smaller circles indicate individual data points of each replicate (colour matched).
|
