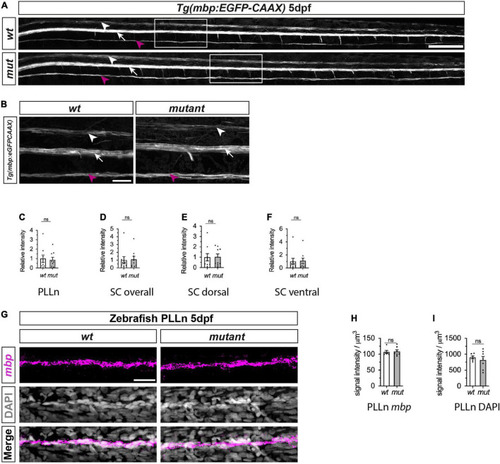
Myelination of PLLn and spinal cord is unaffected by absence of functional Sarm1 in zebrafish. (A) Max projection of the lateral view of wild-type (wt) Tg[mbp:EGFP-CAAX] and sarm1SA11193/SA11193 (sarm1 mutant, mut) Tg[mbp:EGFP-CAAX] 5dpf larva. Arrowhead (white) delineates the dorsal spinal cord; Arrow (white) marks the ventral spinal cord; Arrow (magenta) pinpoints the PLLn. Scale bar 100 μm. (B) Zoomed in lateral view of spinal cord and PLLn (area indicated by boxes in A). Arrowhead (white) delineates the dorsal spinal cord; Arrow (white) marks the ventral spinal cord; Arrow (magenta). Scale bar 25 μm. (C) Relative intensity of GFP in PLLn of Tg[mbp:EGFP-CAAX] wt, 1.0 ± 0.38and sarm1 mutant (mut), 0.86 ± 0.28 (mean and SEM, n = 9; p = 08633). (D) Relative intensity of GFP in the dorsal and ventral spinal cord combined of Tg[mbp:EGFP-CAAX] wt, 1.0 ± 0.44 and sarm1 mutant,1.08 ± 0.38 (mut) (mean and SEM, n = 9; p = 08633). (E) Relative intensity of GFP in the dorsal spinal cord of Tg[mbp: EGFP-CAAX] wt, 1.0 ± 0.35 and sarm1 mutant (mut), 1.03 ± 0.28 (mean and SEM, n = 9; p = 09314). (F) Relative intensity of GFP in the ventral spinal cord of Tg[mbp:EGFP-CAAX] wt, 1.0 ± 0.48 and sarm1 mutant (mut), 1.1 ± 0.44 (mean and SEM, n = 9; p = 08633). (G) MAX projection, lateral view of PLLn of wt and sarm1 mutant (mutant) 5dpf larvae showing mbp (magenta) mRNA expression. Nuclei labeled with DAPI (gray). Scale bar 25 μm. (H) Quantification of mbp mRNA signal intensity/um in PLLn of wt, 107.0 ± 4.72 and sarm1 mutant, 108.82 ± 5.14 (mut) 5dpf larvae (mean and SEM, WT n = 6; MUT n = 7; p = 0.8357). (I) Quantification of DAPI signal intensity/μm in PLLn of wt, 902.5 ± 45.2 and sarm1 mutant (mut), 822 ± 108.77, 5dpf larvae (mean and SEM, WT n = 6; MUT n = 7; p = 0.7308).
|
