
FIGURE
Figure 3
- ID
- ZDB-FIG-230406-29
- Publication
- Botos et al., 2023 - Transcriptomic data meta-analysis reveals common and injury model specific gene expression changes in the regenerating zebrafish heart
- Other Figures
- All Figure Page
- Back to All Figure Page
Figure 3
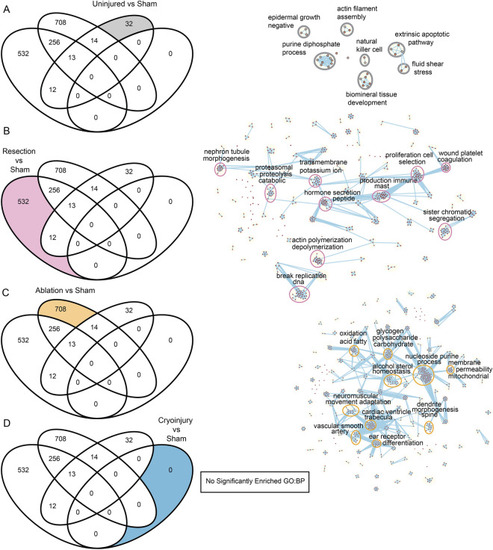
Biological process analysis of DEGs unique to different regeneration models. On the left, Venn diagrams of enriched Gene Ontology Biological Processes showing the specific GO:BP for each condition of interest analyzed labelled in color. On the right, Cytoscape representations of most enriched processes. Shown are data from the comparisons of the different injury models. (A) Uninjured vs sham, (B) Resection vs sham, (C) Ablation vs sham, (D) Cryoinjury vs sham, revealing no significantly enriched terms. |
Expression Data
Expression Detail
Antibody Labeling
Phenotype Data
Phenotype Detail
Acknowledgments
This image is the copyrighted work of the attributed author or publisher, and
ZFIN has permission only to display this image to its users.
Additional permissions should be obtained from the applicable author or publisher of the image.
Full text @ Sci. Rep.