
Fig. 5
- ID
- ZDB-FIG-230313-14
- Publication
- Tang et al., 2023 - Genetic mapping and molecular mechanism behind color variation in the Asian vine snake
- Other Figures
- All Figure Page
- Back to All Figure Page
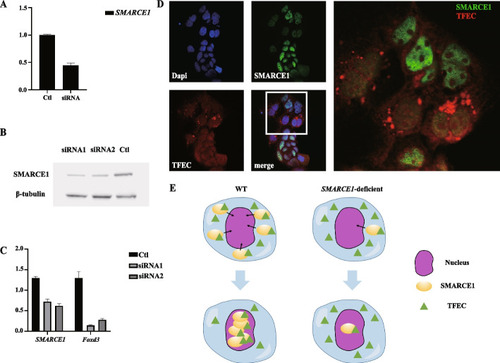
SMARCE1 deficiency in Caco2 cells blocks recruitment of tfec in nucleus. A SMARCE1 expression in purified Caco2 cell population determined by qRT-PCR. Ctl, control group; siRNA, siRNA-injected group. B Immunoblotting analysis of SMARCE1 in Caco2 cells. Ctl, control group; siRNA1 and siRNA2, siRNA-injected groups. C SMARCE1 and Foxd3 expression in purified Caco2 cell population determined by qRT-PCR. Ctl, control group; siRNA1 and siRNA2, siRNA-injected groups. D Immunofluorescence staining of SMARCE1 and tfec showing substantial accumulation of tfec fluorescence signals around the nucleus in SMARCE1-deficient Caco2 cells. E Schematic of possible mechanism by which defective SMARCE1 impedes tfec nuclear recruitment |