
Fig. 8
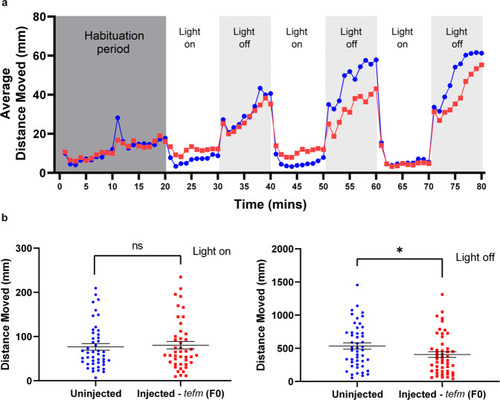
Movement analysis of tefm (F0) zebrafish.
a Average distance moved (mm) of 5 dpf uninjected (blue circles) and injected - tefm (F0) (red squares) zebrafish exposed to three cycles of 10 min light on and 10 min light off after a 20-min habituation period. Each point represents 1 min, n = 48 uninjected and n = 48 injected - tefm (F0). b Total distance moved (mm) of 5 dpf uninjected (blue circles) and injected - tefm (F0) (red squares) zebrafish for the first 5-min of light on (left image) and light off (right image) periods from (a). Right image (light off), p = 0.0395, two-sided Mann–Whitney test, n = 48 uninjected and 48 injected – tefm (F0). Left image (light on), p = 0.5767, two-sided Mann–Whitney test. Error bars = mean ± SEM ns not significant, *p < 0.005. Source data are provided as a Source Data file. |
| Fish: | |
|---|---|
| Knockdown Reagents: | |
| Observed In: | |
| Stage: | Day 5 |