
Fig. 4
- ID
- ZDB-FIG-230224-7
- Publication
- Balamurugan et al., 2022 - PHLPP1 promotes neutral lipid accumulation through AMPK/ChREBP-dependent lipid uptake and fatty acid synthesis pathways
- Other Figures
- All Figure Page
- Back to All Figure Page
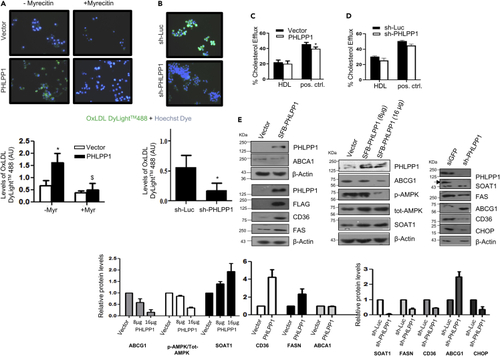
PHLPP1 deficiency suppresses lipid metabolism gene expression (A and B) Fluorescent images of DyLight™488 OxLDL-treated Hoechst-stained PHLPP1 overexpressing (A) or knockdown (B) RAW 264.7 cells along with quantification (bottom); Each image in (A and B) is a representative image of three different experiments with a minimum of 10 different fields in each experiment. Images are taken at |×20×| magnification; Statistical analysis in (A) was performed using one-way ANOVA followed by Bonferroni′s post hoc test (∗p < 0.05, vs Vector-Myr; $p < 0.05 vs PHLPP-Myr); Statistical analysis in (B) was performed using two-tailed t-test (∗p < 0.05, vs sh-Luc). (C and D) BODIPY-labeled cholesterol efflux quantification in PHLPP1 overexpressing (C) or knockdown cells (D); statistical analysis was performed using one-way ANOVA followed by Bonferroni′s post hoc test (∗p < 0.05 vs Vector). (E) Protein levels of foam cell markers in PHLPP1 overexpressing or knockdown cells along with densitometric quantification (bottom). Data are a representative of three independent experiments unless specified. Numerical data are expressed as mean ± SEM [except mean ± SD for (E)-CHOP (n = 2)]. |