
FIGURE
Figure 4
- ID
- ZDB-FIG-230217-172
- Publication
- Li et al., 2023 - Effects of Nutritionally Induced Obesity on Metabolic Pathways of Zebrafish
- Other Figures
- All Figure Page
- Back to All Figure Page
Figure 4
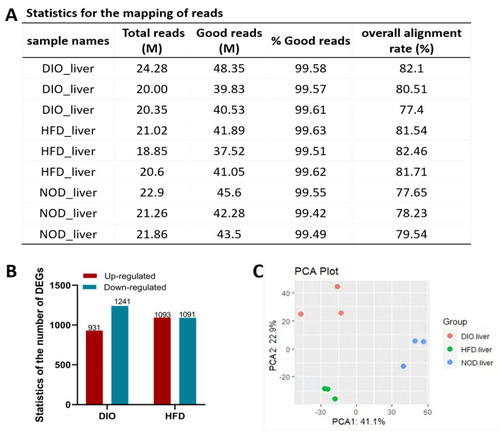
Identification of DEGs induced by HFD and DIO in zebrafish. (A) Statistics for the mapping of reads in three groups. (B) The number of DEGs between groups of different diets (fold change ≥ 1.5 and p-value ≤ 0.05). (C) The principal component analysis (PCA) of differentially expressed genes in three groups. |
Expression Data
Expression Detail
Antibody Labeling
Phenotype Data
Phenotype Detail
Acknowledgments
This image is the copyrighted work of the attributed author or publisher, and
ZFIN has permission only to display this image to its users.
Additional permissions should be obtained from the applicable author or publisher of the image.
Full text @ Int. J. Mol. Sci.