
Fig. 4
- ID
- ZDB-FIG-230124-55
- Publication
- Megat et al., 2023 - Integrative genetic analysis illuminates ALS heritability and identifies risk genes
- Other Figures
- All Figure Page
- Back to All Figure Page
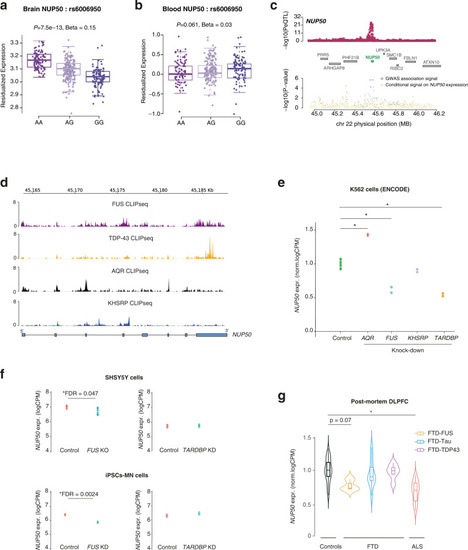
Genetics of NUP50 expression in ALS-FTD.
a, b Boxplot showing the association between a single-nucleotide polymorphism (SNP) (rs6006950) that tags the ALS genome-wide association studies (GWAS) risk loci at NUP50 and gene expression level of NUP50 in DLPFC (a) and blood from the GTEx consortium (b). Each dot represents an individual patient carrying the corresponding rs6006950 SNP allele combination. rs6006950 is significantly associated with the expression level of NUP50 in DLPFC, but not in blood. Linear regression between each genotype and residualized NUP50 expression generates p-values reported in (a) (beta = 0.15; p = 7.5 × 10⁻¹³) and (b) (beta = 0.02; p = 0.061). Boxplot shows median and quartile distributions, the upper and lower lines representing the 75th and 25th percentiles. c LocusZoom style plot for the region surrounding NUP50 shows colocalization of the DLPFC NUP50 expression quantitative loci (eQTL) (top panel) and ALS GWAS association signal (bottom). ALS TWAS signal at the NUP50 locus (gray) and TWAS signal after removing the effect of NUP50 expression (yellow). This analysis shows that the association is largely explained by NUP50 expression. d Intersection between the 6 RBPs associated with ALS and NUP50 genes coordinates identifies 4 RBP binding sites. Normalized CLIPseq tracks shows RNA-binding of 4 RBPs on the NUP50 gene. e Differential expression analysis of NUP50 mRNA in K562 cells (ENCODE consortium) upon AQR, FUS, TDP-43 and KHSRP knockdown. * indicates genome-wide significant changes at FDR < 0.05 (Source Data). f Differential expression analysis of NUP50 mRNA in neuronal cell lines SHSY5Y and iPSCs-derived motorneurons upon TARDBP and FUS knockdown. p-values were adjusted for multiple comparison FDR < 0.05. * indicated genome-wide significant changes in genes expression at FDR < 0.05. g Differential expression analysis of NUP50 mRNA of ALS-FTD patients in post-mortem DLPFC tissues. * indicates genome-wide significant change in gene expression at a FDR < 0.05. n = 23 controls, n = 3 FTD-FUS, n = 12 FTD-Tau, n = 6 FTD-TDP43 and n = 22 ALS. p-values were adjusted for multiple comparison FDR < 0.05. Boxplots show median and quartile distributions, the upper and lower lines representing the 75th and 25th percentiles. |