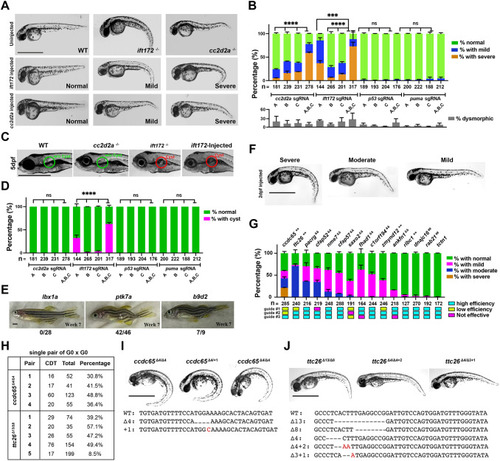
Recapitulation of null phenotypes in G0 embryos by three-guide targeting of ift172 and cc2d2a. (A) Lateral view images of 2 dpf zygotic WT, cc2d2a−/− and ift172−/− embryos, as well as representative images of observed cc2d2a and ift172 CRISPR G0 ‘normal’, ‘mild’ and ‘severe’ CDT embryos in each group. (B) Quantification of CDT phenotypes at 2 dpf after injections of single- or three-guide Cas9 RNPs against cc2d2a, ift172, p53 and puma. Embryos were first sorted for dysmorphic phenotypes (gray, lower panel) at 1 dpf. Non-dysmorphic embryos were then scored and counted at 2 dpf for the degree of CDT phenotype as defined in A. The percentage with normal tail (green), or mild (blue) or severe (orange) CDT is indicated. ns, not significant; ***P<0.001, ****P<0.0001. Fisher's exact test for severe versus other phenotype. The n numbers in each group shown are from at least two independent experiments. Error bars represent ±s.e.m. (C) Representative lateral views of 5 dpf zygotic WT, cc2d2a−/− and ift172−/−, and an example of an injected embryo at 5 dpf with pronephric cyst. (D) Quantification of cysts at 5 dpf after injections of single- or three-guide Cas9 RNPs against cc2d2a, ift172, p53, puma and tctn1. The percentage with (pink) or without (green) pronephric cyst formation is indicated. ns, not significant; ****P<0.0001. Fisher's exact test for cysts versus no cysts. The n numbers in each group shown are from at least two independent experiments. Error bars represent ±s.e.m. (E) Representative images of the lateral view of WT adult zebrafish at 7 wpf injected with four lbx1a gRNAs as negative controls, four-guide Cas9 RNP targeting ptk7a as positive controls or b9d2. Numbers of observed over analyzed are noted. (F) Representative images of observed 2 dpf CRISPR-injected ‘severe’, ‘moderate’ and ‘mild’ G0 embryos for each gene of interest. (G) Quantification of CDT phenotypes at 2 dpf after injection of three-guide Cas9 RNPs against 15 novel cilia gene candidates and tctn1. The percentage with normal tail (green), and mild (magenta), moderate (blue) or severe (orange) CDT is indicated. The n numbers in each group shown are from at least two independent experiments. Error bars represent ±s.e.m. The gRNA efficiency was determined by high-resolution melting curve analysis and color-labeled with blue (high efficiency), yellow (low efficiency) and magenta (without efficiency). The source of these novel genes is indicated: **genes from CiliaCarta top 50 genes; &&genes from Patir et al. (2020); ##genes from Reiter proteomic analysis. (H) Table depicting the number of 2 dpf F1 embryos with different phenotypes from single-pair breedings of injected ccdc65 or ttc26 G0s. (I,J) Representative gross images of 2 dpf embryos with ccdc65 (I) and ttc26 (J) compound mutations. Mutations of the embryos with CDT from the two injected clutches were validated by Sanger sequencing. Sequencing results are listed comparing with WT. ‘–’ indicates the deletion. Nucleotides in red indicate the deletion. Scale bars: 1000 μm.
|
