
Figure 3
- ID
- ZDB-FIG-221214-84
- Publication
- Wang et al., 2022 - Methyltransferase SMYD3 impairs hypoxia tolerance by augmenting hypoxia signaling independent of its enzymatic activity
- Other Figures
- All Figure Page
- Back to All Figure Page
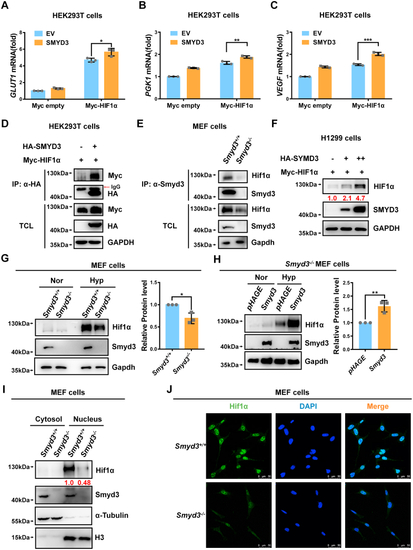
SMYD3 binds to and stabilizes HIF1α, leading to an increase of nuclear HIF1α and enhancement of HIF1α-mediated target genes expression.A–C, qPCR analysis of GLUT1 (A), PGK1 (B), and VEGF (C) mRNA in HEK293T cells cotransfected with Myc-HIF1α or Myc empty vector (control) together with pCMV-SMYD3 or pCMV empty vector (EV) (control) for 24 h. Data show mean ± SD; Student’s two-tailed t test. ∗p < 0.05, ∗∗p < 0.01, ∗∗∗p < 0.001. Data from three independent experiments. D, co-immunoprecipitation of HA-SMYD3 with Myc-HIF1α. HEK293T cells were co-transfected with indicated plasmids for 24 h. Anti-HA antibody-conjugated agarose beads were used for immunoprecipitation, and the interaction was detected by immunoblotting with the indicated antibodies. E, endogenous interaction between Smyd3 and Hif1α. Smyd3-deficient or wildtype MEF cells (Smyd3−/− or Smyd3+/+) under hypoxia for 4 h and anti-HIF1α antibody was used for immunoprecipitation. F, immunoblotting of exogenous Myc-HIF1α expression in H1299 cells transfected with an increasing amount of HA-SMYD3 expression plasmid (HA empty vector [-] was used as a control). G, immunoblotting of endogenous HIF1α expression in Smyd3-deficient or wildtype MEF cells (Smyd3−/− or Smyd3+/+) under normoxia (21% O2) or hypoxia (1% O2) for 4 h. The relative intensities of Hif1α were determined by normalizing the intensities of Hif1α to the intensities of Gapdh. Data show mean ± SD; Student’s two-tailed t test. ∗p < 0.05. Data from three independent experiments. H, immunoblotting of endogenous Hif1α expression in Smyd3-deficient MEF cells reconstituted with or without wildtype Smyd3 by lentivirus under normoxia (21% O2) or hypoxia (1% O2) for 4 h. The relative intensities of Hif1α were determined by normalizing the intensities of Hif1α to the intensities of Gapdh. Data show mean ± SD; Student’s two-tailed t test. ∗∗p < 0.01. Data from three independent experiments. I, Smyd3-deficient or wildtype MEF cells (Smyd3−/− or Smyd3+/+) were cultured under hypoxia for 4 h. Western blot analysis was used to detect Smyd3 and Hif1α in cytosol and nuclear fractions. J, confocal microscopy image of endogenous Hif1α in Smyd3-deficient or wildtype MEF cells (Smyd3−/− or Smyd3+/+) under hypoxia for 4 h. Scale bar = 50 μm. MEF, mouse embryonic fibroblast; qPCR, quantitative RT–PCR; HIF, hypoxia-inducible factor. |