FIGURE

Figure 1

ID
ZDB-FIG-221214-210
Publication
Lee et al., 2022 - Evaluation of Cisplatin-Induced Pathology in the Larval Zebrafish Lateral Line
Other Figures
All Figure Page
Back to All Figure Page
Figure 1

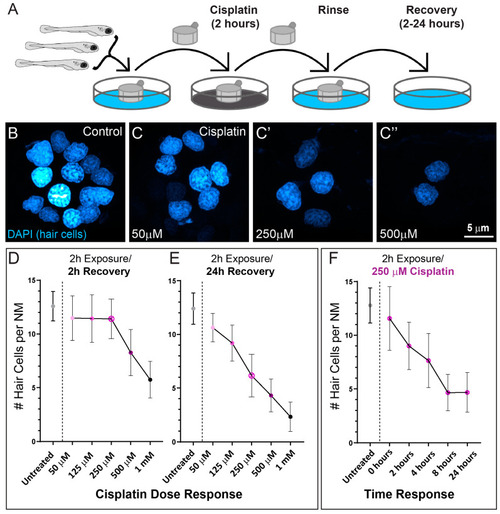
Dose- and time- response relationships of lateral line hair cell loss following 2 h exposure to cisplatin. (A) Diagram of standardized larval zebrafish cisplatin exposure protocol. Larvae (6 dpf) were placed into cell strainers and moved between cisplatin exposure and EM rinse steps, while being allowed to swim freely in EM during recovery. (B,C) Maximum intensity projection images of neuromast hair cell nuclei labeled with DAPI in either control (B) or cisplatin-treated (CC”) larvae following 24 h recovery. (D,E) Cisplatin dose response relationship of hair cell loss per neuromast following either 2 h (D) or 24 h (E) recovery. Each dot represents the mean number of hair cells from 47–50 neuromasts/3 experimental trials. Note the delay in maximal hair cell loss at all doses examined. (F) Time response relationship following exposure to 250 µM cisplatin. Each dot represents the mean number of hair cells from 16–20 neuromasts. Maximal hair cell loss appeared to occur between 4–8 h following cisplatin exposure. Bars = SD.

Expression Data

Expression Detail
Antibody Labeling
Phenotype Data
Fish:
Condition:
Observed In:
Stage: Day 6

Phenotype Detail
Acknowledgments
This image is the copyrighted work of the attributed author or publisher, and ZFIN has permission only to display this image to its users. Additional permissions should be obtained from the applicable author or publisher of the image. Full text @ Int. J. Mol. Sci.