
Figure 2
- ID
- ZDB-FIG-221211-186
- Publication
- Gebuijs et al., 2022 - Targeting fibroblast growth factor receptors causes severe craniofacial malformations in zebrafish larvae
- Other Figures
- All Figure Page
- Back to All Figure Page
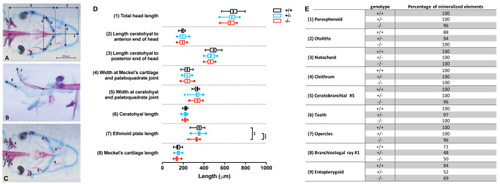
Morphometrical analysis of cartilage and bone elements wild type, heterozygous and mutant fgfr2 zebrafish at 5 dpf.
Morphometrical analysis of cartilage and bone elements wild type, heterozygous and mutant fgfr2 zebrafish at 5 dpf. (A) Ventral view of wild type zebrafish stained for cartilage (blue) and bone (red) indicating the parameters 1–6 assessed in this study. The scale bar indicates 200 µm. (B) A lateral view to indicate morphometrical parameter 7 (the ethmoid plate) and 8 (Meckel’s cartilage). (C) Ventral view to indicate the nine mineralized elements scored for presence or absence. (D) The length of the cartilage elements in the three genotypes of zebrafish: wildtypes (+/ +, n = 17), heterozygotes (+/ −, n = 28) and homozygous mutants (−/ −, n = 26). The median is represented by the line within the box; the box shows interquartile range. The whiskers are drawn left to the 5th percentile and right to the 95th. Points beyond the 5–95 interval are drawn as individual dots. The mean is indicated by a “+” symbol. Data were statistically analyzed using non-parametric Kruskal–Wallis test and asterisks indicate statistical differences; ∗∗p < 0.01, ∗∗∗ p < 0.001. (E) Percentages of mineralized elements present in wildtypes (+/ +, n = 17), heterozygotes (+/ −, n = 31) and homozygous mutants ( −/ −, n = 26). Data were statistically analyzed by Fisher’s exact test. |
| Fish: | |
|---|---|
| Observed In: | |
| Stage: | Day 5 |