
Figure 3
- ID
- ZDB-FIG-221118-190
- Publication
- Ding et al., 2022 - A phenotype-based forward genetic screen identifies Dnajb6 as a sick sinus syndrome gene
- Other Figures
- All Figure Page
- Back to All Figure Page
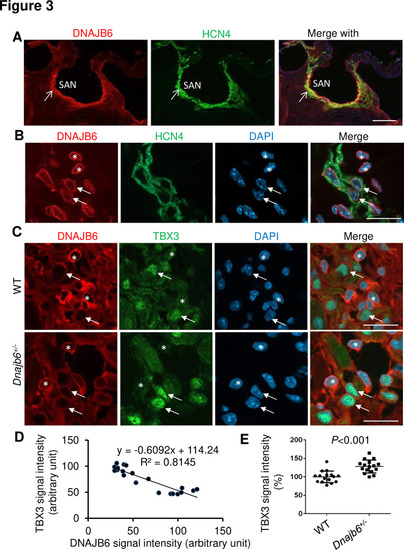
Expression and localization of DNAJB6 in the mouse SAN.(A) The anti-DNAJB6 antibody immunostaining signal largely overlapped with the HCN4 immunostaining signal in the mouse SAN tissues under low magnification. (B) Under higher magnification, expression of DNAJB6 (red) only partially overlapped with HCN4 (green) as revealed by antibody co-immunostaining. Arrows point to cells with overlapping patterns. Stars indicate cells with no-overlapping. (C) Shown are fluorescent images after DNAJB6 and TBX3 antibody co-immunostaining indicating expression of DNAJB6 protein in the WT versus Dnajb6+/- +/- mouse SAN. Arrows point to cells with weak DNAJB6 but strong TBX3 immunostaining signal. Stars indicate cells with strong DNAJB6 but low level of TBX3 immunostaining signal. (D) Quantification and correlation analysis of DNAJB6 and TBX3 immunostaining signal in WT SAN. (E) Quantification analysis of TBX3 signal in the WT versus Dnajb6+/- mouse SAN. N=20 cells. Unpaired student’s t-test. Scale bars in A, 50 µm; In B, C, D, 20 µm. |