
Figure 5
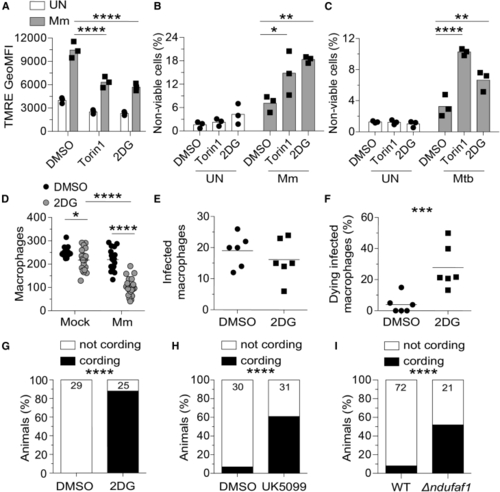
Glycolysis inhibition impairs mitochondrial metabolism and sensitizes infected macrophages to mycobacterium-induced cytotoxicity (A–C) THP-1 macrophages treated with torin1 (400 nM), 2-deoxy-D-glucose (2DG, 5 mM), or DMSO were infected with Mm expressing (A) BFP2, (B) tdTomato, or (C) Mtb expressing tdTomato (MOI = 1). (A) TMRE GeoMFI 1 dpi. (B and C) Percentage of non-viable cells (FVD eFluor 660+) 1 dpi. (D–I) Zebrafish were infected with ∼150 fluorescent Mm via the caudal vein. (D) 5 dpi macrophage numbers in the body of mock- or Mm (E and F) 6-h time-lapse confocal microscopy of (G) Cording in wild-type (WT) animals treated with 2DG or DMSO 5 dpi. (H) Cording in WT animals treated with UK5099 (10 μM) or 0.5% DMSO 5 dpi. (I) Cording in Symbols represent values from individual (A–C) and (K) wells or (D–F) animals. (A–C) Bars and (D–F) horizontal lines indicate mean values. (G–I) Numbers within columns indicate animals per group. Statistical analyses, one-way ANOVA with (A–C) Sidak, (D) Tukey post-tests, (E and F) unpaired Student’s t test, or (G–I) Fisher’s exact test. (E and F). Time-lapse data were pooled from two independent experiments. Data are representative of (A), (G), and (H), two independent experiments. See also |
Reprinted from Cell, 185(20), Pagán, A.J., Lee, L.J., Edwards-Hicks, J., Moens, C.B., Tobin, D.M., Busch-Nentwich, E.M., Pearce, E.L., Ramakrishnan, L., mTOR-regulated mitochondrial metabolism limits mycobacterium-induced cytotoxicity, 3720-3738.e13, Copyright (2022) with permission from Elsevier. Full text @ Cell