
Figure 1.
- ID
- ZDB-FIG-221018-168
- Publication
- Jimenez et al., 2022 - A regulatory network of Sox and Six transcription factors initiate a cell fate transformation during hearing regeneration in adult zebrafish
- Other Figures
- All Figure Page
- Back to All Figure Page
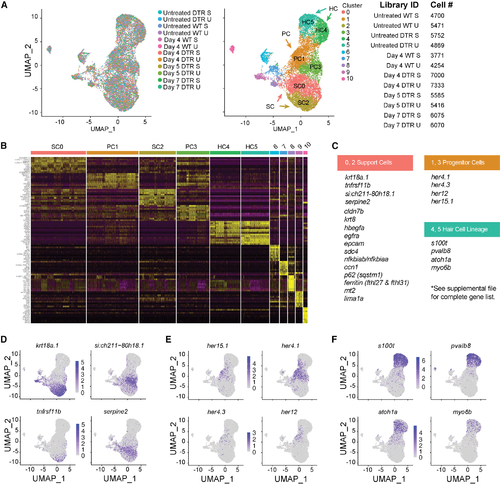
scRNA-seq of the auditory and vestibular epithelia identifies gene expression (A) Left: scRNA-seq UMAP of 15,443 single cells collected from 12 samples. Each dot represents a single cell and colors distinguish samples. Middle: cells were clustered and labeled based on known cell markers. A single, joint clustering detects 11 cell populations. Clusters 0 to 5 consist of cells that contribute to the sensory epithelium: support cells (SCs) are clusters 0 (SC0) and 2 (SC2); progenitor cells (PCs) are clusters 1 (PC1) and 3 (PC3); and hair cells (HC) are clusters 4 (HC4) and 5 (HC5). Right: identifiers and cell counts for samples collected for scRNA-seq. S, saccule; U, utricle; DTR, heterozygous Tg(myo6b:hDTR) transgenic zebrafish; Day, number of days after DT injection, for a total of 66,293 sampled cells. (B) Heatmap showing the relative expression levels of the top 10 differentially expressed genes (y axis) from each cluster (x axis). The cell population identity assigned to each cluster is indicated above each column and colors correspond to clusters in (B). (C) Table of top significant marker genes. (D–F) (D) UMAP plots of marker genes overrepresented in SCs, (E) PCs, and (F) HCs. |