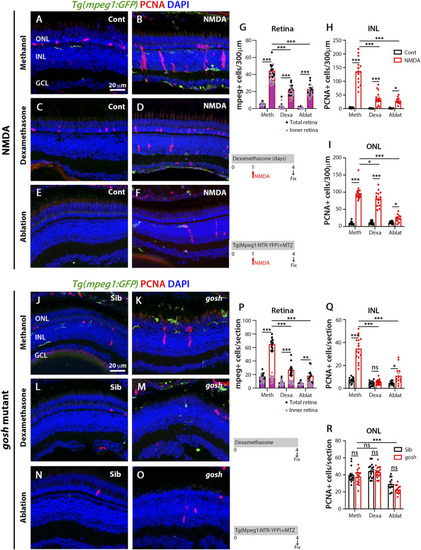
Suppressing microglia affect Müller glia proliferation in NMDA-injured retina and gosh mutants. At 72 h after control injection, 3 wpf wild-type Tg(mpeg1:eGFP) retinas display few thin and ramified microglia/macrophages through the retina and PCNA-positive cells in the ONL and INL, corresponding to rod precursors and Müller glia/NPCs, respectively (A). At 72 h following NMDA injection, microglia/macrophages increase in numbers in the inner retina, and PCNA expression is strongly stimulated (B). Control and NMDA-damaged retinas were treated with dexamethasone (C,D) or microglia/macrophages ablated with the mpeg1:NTR-eYFP transgene and metronidazole (E,F). Compared to methanol-treated control retinas, NMDA-damaged retinas possess significantly fewer microglia/macrophages (G) and PCNA-positive INL and ONL cells (H,I, respectively) following either dexamethasone or ablation treatment. Control gosh sibling retinas display some ramified microglia/macrophages and few PCNA-positive cells (J). gosh mutant retinas have activated microglia/macrophages in the ONL and PCNA-expressing INL and ONL cells (K). Sibling control and gosh mutant retinas were treated with dexamethasone (L,M) or microglia/macrophages were ablated (N,O). Compared to methanol-treated controls, dexamethasone treatment (M) or microglia/macrophage ablation (O) significantly reduces the number of microglia/macrophages (P) and PCNA-positive INL and ONL cells (Q,R, respectively). Histograms display the number of eGFP-positive microglia/macrophages (G) and PCNA-labeled cells (H,I) in 300 μm of the central region of the NMDA-damaged retinas or in the entire section of gosh mutant retinas (P–R). Bars and lines indicate mean ± SEM, n = 12–17. Black bars: control retinas; red bars: NMDA-injected or gosh mutant retinas. Panels (G,P): black dots display total number of mpeg:GFP + cells in the retina, and pink dots show total number of mpeg:GFP + cells in the inner retina. One-way ANOVA with Tukey’s multiple comparisons test was applied for all the graphs (ns p > 0.05; *p < 0.05; **p < 0.001; ***p < 0.001).
|
