
Fig. 3
- ID
- ZDB-FIG-220819-54
- Publication
- Wang et al., 2021 - Transcriptome analysis of the early stage ifnlr1-mutant zebrafish indicates the immune response to auditory dysfunction
- Other Figures
- All Figure Page
- Back to All Figure Page
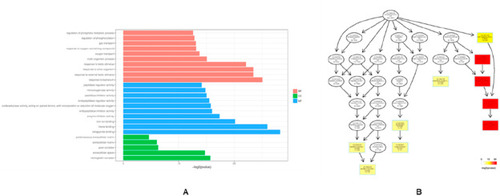
Fig. 3. GO bar chart with significant accumulation and dendrogram of BP terms. (A) GO bar chart with significant accumulation: Significantly enriched GO terms based on p ≤ 0.05, horizontal axis means logarithm of p value, vertical axis means the GO items, BP terms are shown in red, MF terms are shown in blue, CC terms are shown in green. (B) Dendrogram of BP terms: Each node represents a GO term, and the box represents the GO term of the top 10 in the order of the degree of significant accumulation. The depth of the color represents the degree of enrichment, and the darker the color, the higher the degree of enrichment. Each node displays GO ID and GO description. . (For interpretation of the references to color in this figure legend, the reader is referred to the Web version of this article.) |
Reprinted from Gene expression patterns : GEP, 43, Wang, W.Q., Qiu, S.W., Huang, S.S., Wang, G.J., Han, M.Y., Kang, D.Y., Yuan, Y.Y., Gao, X., Dai, P., Transcriptome analysis of the early stage ifnlr1-mutant zebrafish indicates the immune response to auditory dysfunction, 119229, Copyright (2021) with permission from Elsevier. Full text @ Gene Expr. Patterns