
Fig. 5
- ID
- ZDB-FIG-220802-59
- Publication
- Chen et al., 2022 - Autism-Risk Gene necab2 Regulates Psychomotor and Social Behavior as a Neuronal Modulator of mGluR1 Signaling
- Other Figures
- All Figure Page
- Back to All Figure Page
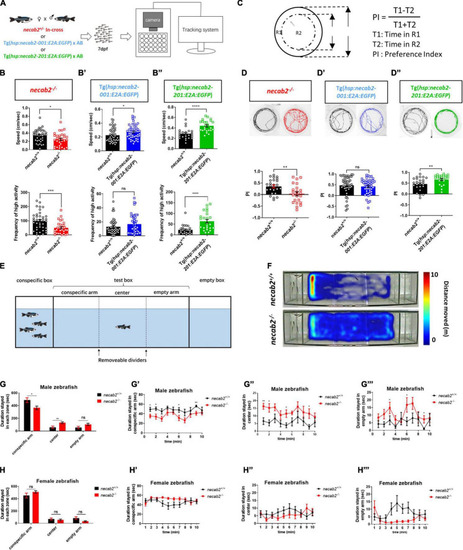
Necab2 is necessary and sufficient to promote psychomotor, thigmotaxis, and social interaction. (A) Workflow and experimental setup. To control for potential differences in the genetic background, tracking experiments were performed blindly on the progeny from heterozygous necab2+/– mating. Genotyping was done after behavioral tracking by PCR. (B–B″) necab2–/– (in red, n = 31, with sibling control n = 38) larvae exhibited locomotor hypo-activity while Tg(hsp:necab2-001:E2A:EGFP) larvae (in blue, n = 48, with sibling control n = 45) and Tg(hsp:necab2-201:E2A:EGFP) larvae (in green, n = 24, with sibling control n = 24) yielded the opposite. (ns p ≥ 0.05, *p < 0.05, ***p < 0.001, ****p < 0.0001, Student’s t-test or Mann-Whitney U test). (C) Diagram of the thigmotaxis behavior test. The equation for calculating the preference index (PI) was shown at right. PI was calculated as the subtraction of the locomotion duration in the outer region (R1) and inner region (R2) divided by the total duration. R1 and R2 were of the same area. (D–D″) The necab2–/– (in red, n = 23, with sibling control n = 24) larvae exhibited decreased preference for the periphery region while Tg(hsp:necab2-201:E2A:EGFP) larvae (in green, n = 23, with sibling control n = 24) yields the opposite. Tg(hsp:necab2-001:E2A:EGFP) larvae (in blue, n = 48, with sibling control n = 47) showed no difference. (ns p ≥ 0.05, **p < 0.01, Student’s t-test or Mann-Whitney U test). (E) Diagram of the three-chamber social behavior test. Four unfamiliar conspecifics with mixed-sex were placed in the conspecific box while the box of the same size on the opposite end was empty. The test box in between was evenly divided into three zones—conspecific arm, center, and empty arm. The fish in the test was placed in the center bordered by two opaque dividers for one minute as adaption. (F) Representative heat maps of the duration stayed in each zone in the necab2–/– zebrafish and its wild-type sibling. (G–G″′) Duration stayed in each zone of the male progeny of in-crossed necab2+/– fish at 3 months old. Columns showed total duration spent in each zone of necab2+/+ (n = 9) and necab2–/– (n = 9). Line diagrams showed the duration per minute spent in each zone. (ns p ≥ 0.05, *p < 0.05, **p < 0.01 Student’s t-test or Mann-Whitney U test). (H–H″′) Duration stayed in each zone of the female progeny of in-crossed necab2+/– fish at 3 months old. Columns showed total duration spent in each zone of necab2+/+ (n = 9) and necab2–/– (n = 9). Line diagrams showed the duration per minute spent in each zone. (ns p ≥ 0.05, Student’s t-test or Mann-Whitney U test). The duration was not significantly different at each time point. Speed: average speed calculated by the computer in 15–30 min. Frequency of high activity: the times that more than 80% of the pixels from the zebrafish body moved per second. |
| Fish: | |
|---|---|
| Observed In: | |
| Stage: | Day 5 |