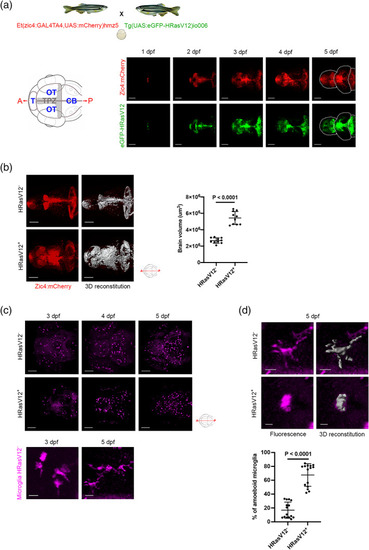
HRasV12 expression in the proliferating regions of the developing CNS alters microglia morphology. (a) Schematic representation of the zebrafish germline system used to induce HRasV12 expression based on the outcross of the indicated fish lines. Schematic anterior‐posterior dorsal view of the brain representing the main sub‐divisions: telencephalon (T), optic tectum (OT) cerebellum (CB) and tectal proliferation zone (TPZ) in gray. Confocal images showing mCherry and eGFP‐HRasV12 fluorescent signal in the proliferating regions of the developing brain of HRasV12+ larvae from 1 to 5 dpf. White dotted lines mark the main brain subdivisions. Scale bar represents 100 μm. (b) Brain volume was assessed using Imaris surface tool to build the segmented images (right panels) of the mCherry signal (left panels) of proliferating regions of the developing brain from 5 dpf HRasV12− (top panels) and HRasV12+ (bottom panels). Scale bar represents 100 μm. Brain volumes of 5 dpf HRasV12− and HRasV12+ larvae were quantified. HRasV12−: n = 10; HRasV12+: n = 10; N = 3. (c) Confocal images of microglia (magenta) distribution throughout the developing brain of HRasV12− (top panels) and HRasV12+ brains (bottom panels) from 3 to 5 dpf, using 4C4 antibody to specifically label microglia. Scale bar represents 100 μm. Close‐ups of microglia at 3 dpf and 5 dpf under physiological condition (HRasV12−) allow to determine their morphology: amoeboid and ramified. Scale bar represents 10 μm. (d) Close‐ups of microglia from 5 dpf HRasV12− (top panels) and HRasV12+ (bottom panels) larvae (left panels) and their segmented images in 3D (right panels) using Imaris surface tool, to assess microglia morphology. Scale bar represents 10 μm. The number of amoeboid microglia was quantified within the microglial population of 5 dpf control and HRasV12+ larvae. Results are shown as a percentage of total microglia. HRasV12−: n = 15; HRasV12+: n = 15; N = 3. Error bars represent mean ± SD. Images were captured using a Zeiss LSM710 confocal microscope with a 20X/NA 0.8 objective. All images represent the maximum intensity projections of Z stacks
|
