
Fig. 6
- ID
- ZDB-FIG-220726-95
- Publication
- Boger et al., 2022 - Comparative Morphological, Metabolic and Transcriptome Analyses in elmo1-/- , elmo2-/- , and elmo3-/- Zebrafish Mutants Identified a Functional Non-Redundancy of the Elmo Proteins
- Other Figures
- All Figure Page
- Back to All Figure Page
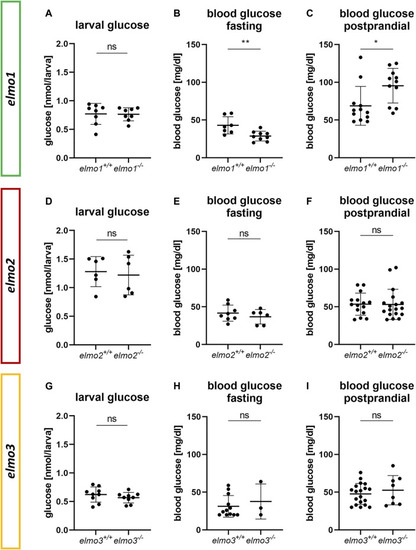
The loss of Elmo1 led to altered blood glucose levels in adult zebrafish. (A) Whole body glucose levels were not changed in elmo1 −/− compared to elmo1 +/+ at 120 hpf. n = 8 samples per group, each containing 20 zebrafish larvae. (B) Fasting blood glucose levels were decreased in adult elmo1 −/− . (C) Postprandial blood glucose levels were increased in adult elmo1 −/− . (D) Whole body glucose levels were not changed in elmo2 −/− compared to elmo2 +/+ at 120 hpf. n = 6 samples per group, each containing 20 zebrafish larvae. (E,F) Fasting and postprandial blood glucose levels were unaltered in adult elmo2 −/− . (G) Whole body glucose levels were not changed in elmo3 −/− compared to elmo3 +/+ at 120 hpf. n = 9 samples per group, each containing 20 zebrafish larvae. (H,I) Fasting and postprandial blood glucose levels were unaltered in adult elmo3 −/− . Blood glucose was obtained from animals of 7–15 mpf. Statistical analysis was done with t-test and Mann-Whitney test. *p < 0.05, **p < 0.01. ns, not significant; hpf, hours post fertilization; mpf, months post fertilization. |
| Fish: | |
|---|---|
| Conditions: | |
| Observed In: | |
| Stage Range: | Day 5 to Adult |