
FIGURE 4
- ID
- ZDB-FIG-220722-13
- Publication
- Godivier et al., 2022 - Growth orientations, rather than heterogeneous growth rates, dominate jaw joint morphogenesis in the larval zebrafish
- Other Figures
- All Figure Page
- Back to All Figure Page
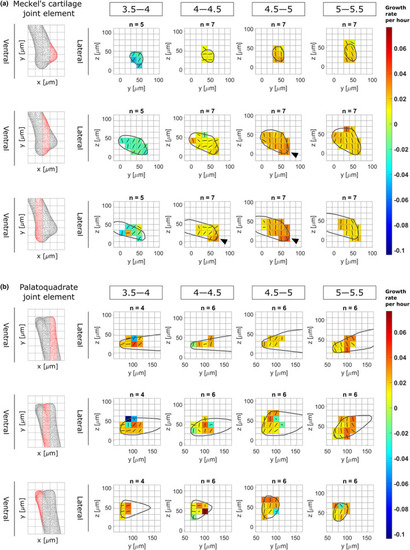
Growth rates from 3.5 to 5.5 dpf in zebrafish jaw joint exhibits spatial and temporal patterns. Maps showing growth rates along the main direction for growth (major axis of the ellipsoid) and their associated directions for each time window (3.5–4, 4–4.5, 4.5–5 and 5–5.5 dpf) in the anterior Meckel's cartilage (a) and posterior palatoquadrate (b) joint elements in the lateral plane. Growth rates are represented by colours, while the direction is shown by solid black lines. Results are displayed across the rudiment's width; views in the ventral plane of each section are displayed on the left panels. Black arrowheads show areas of elevated growth rates |