
Fig. 3
- ID
- ZDB-FIG-220718-26
- Publication
- Darp et al., 2022 - Oncogenic BRAF induces whole-genome doubling through suppression of cytokinesis
- Other Figures
- All Figure Page
- Back to All Figure Page
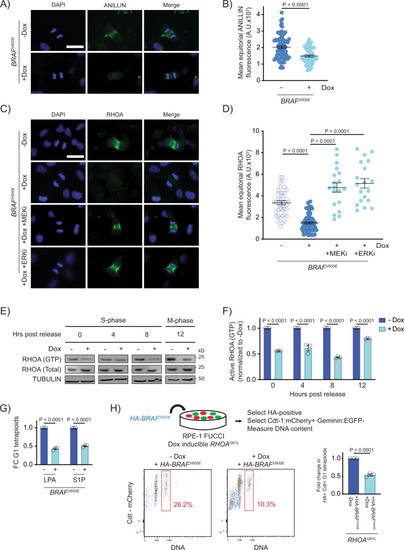
BRAFV600E causes cytokinesis failure by reducing the localization and function of RhoA.
A DAPI and anti-ANILLIN staining in control (−Dox) and BRAFV600E-expressing (+Dox) anaphase RPE-1 cells. Images are maximum intensity projections of z-stacks. Scale bar = 7.5 µM. B Mean ANILLIN fluorescence intensity at the equator of control and BRAFV600E-expressing anaphase RPE-1 cells. N = 79 cells for −Dox and N = 53 for +Dox. Unpaired Student’s t test. Error bars represent mean ± SEM. C DAPI and anti-RHOA staining in -BRAFV600E (−Dox) cells, BRAFV600E-expressing (+Dox) cells, and BRAFV600E-expressing (+Dox) RPE-1 cells treated with MEKi or ERKi. Drugs were added coincident with Dox administration. Images are maximum intensity projections of z-stacks (0.20 µM). Scale bar = 7.5 µM. D Mean RHOA fluorescence intensity at the equator of control RPE-1 cells, BRAFV600E-expressing RPE-1 cells, and BRAFV600E-expressing RPE-1 cells treated with MEKi or ERKi. N = 41 cells for −Dox, N = 68 for +Dox, N = 19 for +Dox +MEKi, and N = 19 for +Dox +ERKi. Brown-Forsythe and Welch one-way ANOVA with Dunnett’s multiple comparisons test. Error bars represent mean ± SEM. E Western blot analysis of immunoprecipitated RHOA-GTP from control (−Dox) and BRAFV600E-expressing (+Dox) RPE-1 cell lysates at different time points post thymidine release. Total RHOA protein and alpha tubulin were used as a controls. A representative of three independent biological replicates is shown. F Western blot quantification of immunoprecipitated RHOA-GTP levels from control (−Dox) and BRAFV600E-expressing (+Dox) RPE-1 cell lysates at different time points post thymidine release. Samples were normalized to the −Dox condition. N = 3 independent experiments. Unpaired Student’s t test. Error bars represent mean ± SEM. G Fold change (FC) in G1 tetraploid RPE-1 FUCCI cells following addition of RHOA activators. LPA (1 µM) and S1P (1 µM) were added coincident with Dox administration. Fold changes in G1 tetraploids relative to the control (+Dox no drug) are shown. N = 3 independent experiments. Unpaired Student’s t test. Error bars represent mean ± SEM. H G1 tetraploid generation following expression of HA-tagged-BRAFV600E in RHOAQ61L-inducible cells. Experimental design (top): RPE-1 FUCCI cells with Dox inducible RHOAQ61L were transiently transfected with an HA-tagged-BRAFV600E-expressing construct and selected accordingly. G1 tetraploids were quantified (bottom left and middle) by gating HA-positive, Cdt-1:mCherry-positive cells with increased Hoechst incorporation. Fold change in G1 tetraploids (bottom right), normalized to control (−Dox) cells. N = 3 independent experiments. Unpaired Student’s t test. Error bars represent mean ± SEM. |