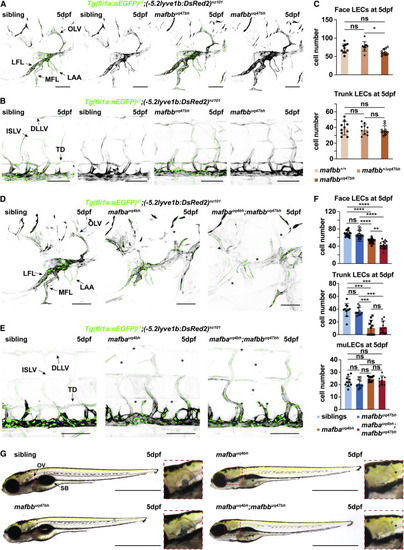
Figure 1. mafba and mafbb are required for facial lymphatic development (A and B) Confocal images of (A) face and (B) trunk lymphatics labeled with Tg(fli1a:nEGFP) (endothelial nuclei, green) and Tg(-5.2lyve1b:DsRed2) (VECs and LECs, grey) in sibling and mafbb mutants at 5 dpf. LFL, lateral facial lymphatic; MFL, medial facial lymphatic; LAA, branchial lymphatic arches; OLV, otolithic lymphatic vessel; DLLV, dorsal longitudinal lymphatic vessel; ISLV, intersegmental lymphatic vessel; TD, thoracic duct. Scale bars, 100 μm. (C) Quantification of LECs in the face and trunk based on (A) in wild-type (mafbb+/+), mafbb heterozygous (mafbb+/uq47bh), and mafbb homozygous mutants (mafbbuq47bh) at 5 dpf. Embryos per genotypes; n = 10. One-way ANOVA: ∗p = 0.0174 for mafbb+/uq47bh versus mafbbuq47bh in face LECs, ns p ≥ 0.177 for other comparisons. (D and E) Confocal images of (D) facial and (E) trunk lymphatics at 5 dpf for siblings and mafba and mafba;mafbb mutants. Transgenic markers described in (A). ∗: absent lymphatics. Scale bars, 100 μm. (F) LEC quantification at 5 dpf; embryos per genotype; n = 17 (face), n = 11 (trunk), n = 10 (muLECs). One-way ANOVA: p values for facial LECs: ns p = 0.7733 for siblings versus mafbb mutants; ∗∗∗∗p < 0.0001 for siblings versus mafba or mafba;mafbb mutants and for mafbb versus mafba or mafba;mafbb mutants; ∗∗p < 0.0047 for mafba versus mafba;mafbb mutants. p values for trunk LECs: ∗∗∗p ≤ 0.0004 for siblings versus mafba or mafba;mafbb and mafba versus mafbb mutants; ∗∗p ≤ 0.0029 for mafbb versus mafba;mafbb mutants. Other comparisons: ns p ≥ 0.9999. Kruskal-Wallis test for muLECs: ns p = 0.070. (G) Gross morphology of embryos at 5 dpf. ∗: absent structures; OV, otolithic vesicle; SB, swim bladder. Scale bars, 1 mm. ns, non-significant; stars are significant; error bars are mean ±SD. See also Figure S1.
|
