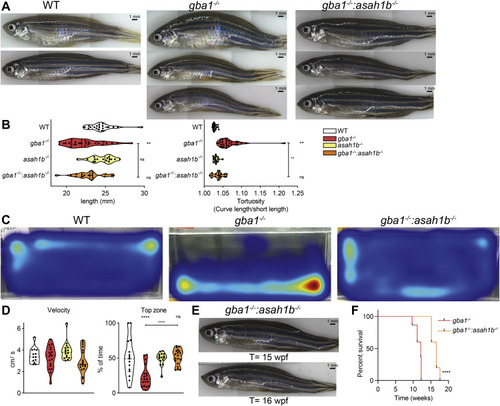
Fig. 7. Phenotypic improvements of adult Asah1b:Gba1 double deficient zebrafish. A: Representative photographs of WT, gba1-/-, and gba1-/-:asah1b-/- zebrafish. B: The length of individual zebrafish is determined (head to tail base) as well as the tortuosity, calculated as ratio of the length along the back divided by the length of the fish, as indication for the curved back. Data of individual zebrafish is depicted in a violin plot; WT (n = 21), gba1-/- (n = 29), asah1b-/- (n = 16), and gba1-/-:asah1b-/- (n = 19) and analyzed using a nonparametric Kruskal–Wallis test with Dunn’s multiple comparison test. C: Representative movement traces of WT, gba1-/,- and gba1-/-:asah1b-/- zebrafish, all at t = 12 wpf. D: Quantification of individual zebrafish average velocity (in cm/s) when in motion and time spend in the top half of the tank. Data of individual zebrafish is depicted in a violin plot; WT (n = 13), gba1-/- (n = 16), asah1b-/- (n = 16), and gba1-/-:asah1b-/- (n = 19) and analyzed using a One-Way Anova with Tukey’s multiple comparison test. E: Photograph of individual gba1-/-:asah1b-/- zebrafish at t = 15 and 16 wpf. F: Kaplan-Meier plot indicating the onset of predetermined symptoms, such as the curved back and abnormal swimming resulting in impaired feeding behavior, of gba1-/- and gba1-/-:asah1b-/- zebrafish; gba1-/- (n = 30), and gba1-/-:asah1b-/- (n = 5). The curves are analyzed using a Log-rank (Mantel-Cos) test. Statistical analysis is depicted of WT versus gba1-/-, asah1b-/- or asah1b-/-:gba1-/-, only when a significant difference is apparent or of gba1-/- versus asah1b:gba1-/- when significant difference is of interest. Ns = not significant, ∗∗p < 0.01 and ∗∗∗∗p < 0.0001. wpf, week postfertilization.
|
