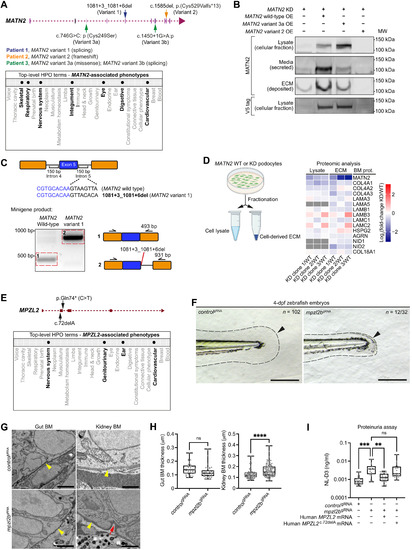
(A) MATN2 genomic structure indicating four pLoF variants (top) and associated phenotypic abnormalities represented as HPO terms (bottom, bolded). (B) Western blots of MATN2 in lysate and ECM fractions derived from endogenous MATN2-depleted human podocytes overexpressing V5-tagged wild-type or variant MATN2. Note that the faint band in the ECM fraction for the MATN2-KD lane is likely residual endogenous MATN2 due to variability in MATN2 knockdown. Immunoblotting source data are available on figshare: 10.6084/m9.figshare.c.5662348. (C) In vitro minigene splicing assay demonstrating altered splicing of MATN2 variant 1. bp, base pairs. (D) Fold change in BM component levels upon MATN2 knockdown as determined by fractional proteomic analysis of podocyte-derived ECM (see table S18; additional quantification data are available on figshare: 10.6084/m9.figshare.c.5662348). (E) MPZL2 genomic structure indicating two 100KGP pLoF variants (top) and associated phenotypic abnormalities (bottom, bolded). (F) Bright-field images of tail regions (dashed lines) in controlgRNA- and mpzl2bgRNA-injected 4-dpf zebrafish embryos. Arrowheads highlight reduced fin fold extension in mpzl2b crispants. Scale bars, 100 μm. (G) Transmission electron microscopy (TEM) of gut and kidney BMs (yellow arrowheads) in control and mpzl2b crispant embryos. Red arrows indicate BM irregularities. Scale bars, 2 μm (gut) and 1 μm (kidney). (H) Quantification of gut (n = 39 each) and kidney (n = 100 each) BM thickness. ****P < 0.0001, unpaired Student’s t test. (I) Assessment of proteinuria (NL-D3 levels) in mpzl2b crispants injected with wild-type human MPZL2 mRNA or MPZL2c.72del variant mRNA (n = 24 each). ***P < 0.001 and **P < 0.01, one-way ANOVA with post hoc Dunnett’s test. For boxplots, edges indicate the 25th and 75th percentiles, the line in the box represents the median, and whiskers mark the minimum and maximum values.
|
