
FIGURE
Figure 3
- ID
- ZDB-FIG-220430-99
- Publication
- Yan et al., 2022 - Functional Study of TMEM163 Gene Variants Associated with Hypomyelination Leukodystrophy
- Other Figures
- All Figure Page
- Back to All Figure Page
Figure 3
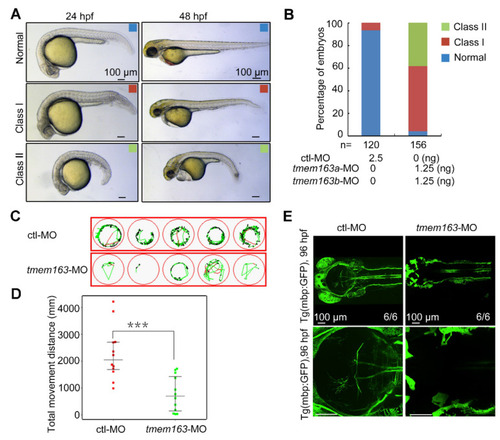
Figure 3. Impact of tmem163 knockdown on morphology, locomotor ability and myelination in zebrafish larvae: (A) Representative images of the normal (blue), mild (red), and severe (green) phenotypes observed in the control and tmem163-MO injected groups at 24 hpf and 48 hpf. Scale bar: 100 μm. (B) Quantification of the percentage of normal, class I, and class II in two groups obtained. The percentages of embryos with each phenotype are shown in the bar graphs, and the number of embryos examined is listed under each bar. (C) Examples of swimming tracks of five single larvae of each condition shown in green at 120 hpf. (D) Scatter plot displaying the total movement distance by different larvae: MO-control (n = 12): 2689 ± 477 mm; tmem163-MO (n = 12): 748 ± 200 mm. *** p < 0.01 (Student’s t-test). (E) Representative pictures of the Tg(mbp:GFP) larvae injected with control and tmem163-MO at 96 hpf (dorsal views with anterior to the left). Scale bar: 100 μm.
|
Expression Data
| Gene: | |
|---|---|
| Fish: | |
| Knockdown Reagents: | |
| Anatomical Term: | |
| Stage: | Day 4 |
Expression Detail
Antibody Labeling
Phenotype Data
| Fish: | |
|---|---|
| Knockdown Reagents: | |
| Observed In: | |
| Stage Range: | Prim-5 to Day 5 |
Phenotype Detail
Acknowledgments
This image is the copyrighted work of the attributed author or publisher, and
ZFIN has permission only to display this image to its users.
Additional permissions should be obtained from the applicable author or publisher of the image.
Full text @ Cells