
Fig. 6.
- ID
- ZDB-FIG-220414-21
- Publication
- Takesono et al., 2022 - Estrogens regulate early embryonic development of the olfactory sensory system via estrogen-responsive glia
- Other Figures
- All Figure Page
- Back to All Figure Page
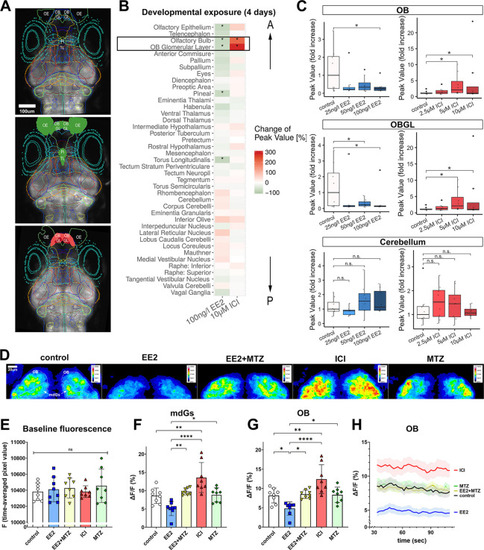
Estrogens/EROB cell cascade inhibits the intrinsic spontaneous neuronal activity in the OB. (A) LSM images of 4 dpf elavl3:GCaMP6s zebrafish embryo brain (dorsal view) of control (top), EE2-exposed (middle) and ICI-exposed embryos (bottom). Each coloured line represents a brain ROI. ROIs for which GCaMP activity is inhibited by EE2 are coloured with green and those activated by ICI are coloured with red (based on the data in Fig. 6B). (B) Heat map displaying changes (%) of GCaMP signals in 41 different brain regions. A black rectangle indicates the most affected ROIs (OB and OBGL). The order of ROIs represents the location of a ROI along anterior-posterior (A-P) axis (top-bottom). *P<0.05 (likelihood ratio test with Tukey's post-hoc test), n=8 each. (C) Dose-dependent effects of EE2 and ICI on intrinsic neuronal activity. *P<0.05 (likelihood ratio test with Tukey's post-hoc), n=8 each. Boxplots show the median with 1st and 3rd quartiles of the distribution. Whiskers extend to the minimum and maximum of the data range within 1.5× the interquartile range; data beyond that range are defined as outliers and plotted individually in black. Overlaying the boxplot is a scatterplot in semi-transparent showing all individual observations. (D) Representative confocal z-projection images of time-averaged GCaMP6s signals in the OB of control, EE2-, ICI-, MTZ- and EE2+MTZ-exposed 4 dpf Tg(ERE:mCherry)×Tg(elavl3:GCaMP6s) embryos. Representative ROIs of left and right mdG1-6 (mdGs) and ROIs of left and right OB are marked with white lines in the control image. (E) Raw baseline fluorescence signal (F) (time-averaged pixel value) of experimental groups. (F,G) Time-averaged intrinsic neuronal activity in mdGs (F) and in OB (G) from each experimental group (n=7-9) are shown as ΔF/F (%). *P≤0.05, **P≤0.01, ****P≤0.0001 (ANOVA with Tukey post-hoc test). (H) Time-course of the intrinsic neuronal activity in the OB. n.s., not significant; OB, olfactory bulb; OBGL, olfactory bulb glomerular layer; OE, olfactory epithelia; Pi, pineal; TL, torus longitudinalis. |