
Figure 6.
- ID
- ZDB-FIG-220326-18
- Publication
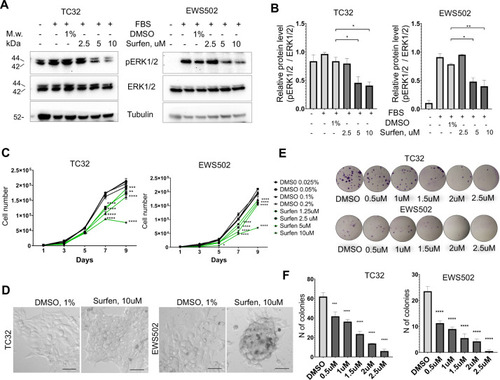
- Vasileva et al., 2022 - Dysregulated heparan sulfate proteoglycan metabolism promotes Ewing sarcoma tumor growth
- Other Figures
-
- Figure 1
- Figure 1—figure supplement 1.
- Figure 1—figure supplement 2.
- Figure 1—figure supplement 3.
- Figure 2
- Figure 2—figure supplement 1.
- Figure 3.
- Figure 4
- Figure 4—figure supplement 1.
- Figure 5.
- Figure 6.
- Figure 7
- Figure 7—figure supplement 1.
- Figure 7—figure supplement 2.
- Figure 7—figure supplement 3.
- All Figure Page
- Back to All Figure Page
( |