|
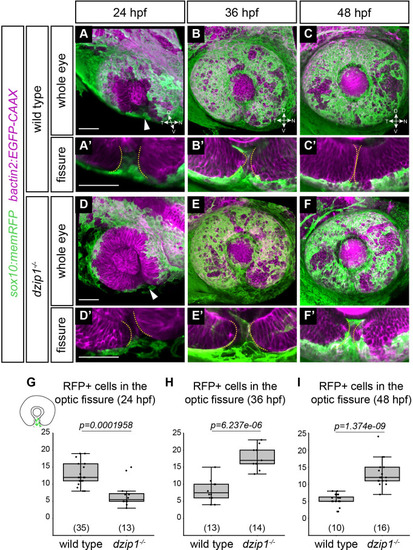
<italic toggle='yes'>Tg(sox10</italic>:<italic toggle='yes'>memRFP)-</italic>positive neural crest cells do not properly localize in the optic fissure in <italic toggle='yes'>dzip1</italic> mutants.Embryos visualized for neural crest (green; Tg(sox10:memRFP)) and cell membranes (magenta; Tg(bactin2:EGFP-CAAX)) in wild type (A-C) and dzip1ts294e mutants (D-F) at 24 hpf (A, D), 36 hpf (B, E), and 48 hpf (C, F). (A’-F’) Zoomed views of images in A-F to facilitate visualization of neural crest cells within the optic fissure. All images are lateral views of 3-dimensional renderings. Some Tg(sox10:memRFP)-positive neural crest cells are detectable in the optic fissure by 24 hpf in both wild type and dzip1-/- embryos (white arrowheads in A, D). (G-I) Quantification of total number of Tg(sox10:memRFP)-positive cells through the length of the optic fissure within the eye at 24, 36, and 48 hpf. n (embryos) for each genotype shown at the base of the graph. P-values were calculated using Welch’s t-test (M-O). Scale bar: 50 μm. D, dorsal; V, ventral; N, nasal; T, temporal.
|