
Fig. 4
- ID
- ZDB-FIG-220224-28
- Publication
- Naser et al., 2021 - Isotope tracing in adult zebrafish reveals alanine cycling between melanoma and liver
- Other Figures
- All Figure Page
- Back to All Figure Page
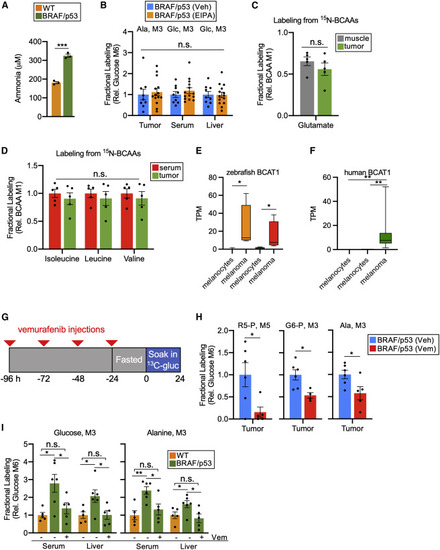
Circulating BCAAs provide melanoma with a source of nitrogen for the alanine cycle, which can be impaired by vemurafenib (A) Concentration of ammonia excreted into tank water from WT and BRAF/p53 fish. Measurements were made 24 h after water refreshing. Each group was housed separately. Values are mean ± SEM; n = 3 zebrafish per condition. (B) Fractional labeling, relative to M6 glucose, of M3 alanine and M3 glucose in BRAF/p53 zebrafish treated with EIPA or DMSO (Veh). Values are mean ± SEM; n = 9–14 zebrafish per condition. (C) Fractional labeling, relative to serum M1 BCAAs, of glutamate in tumor and muscle of BRAF/p53 fish. Serum M1 BCAAs was determined by averaging the values of M1 from isoleucine, leucine, and valine. Data are available in Data S4. Values are mean ± SEM; n = 5 zebrafish. (D) Fractional labeling, relative to serum M1 BCAAs, of isoleucine, leucine, and valine in serum and tumor of BRAF/p53 fish. Data are available in Data S4. Values are mean ± SEM; n = 5 zebrafish per condition. (E) BCAT1 expression in zebrafish melanocytes and BRAF/p53 melanoma cells. Our data are on the left, and data from Venkatesan et al. are on the right. Center line, median; box limits are first and third quartile; whiskers, range. (F) BCAT1 expression in human melanocytes and human melanoma. Data on left are from Haltaufderhyde et al., data in center are from Reeman et al., and our data are on right. (G) Schematic of when vemurafenib and [U-13C] glucose were administered to melanoma-bearing zebrafish. Red triangles denote the timing of vemurafenib injections. (H) Fractional labeling, relative to serum M6 glucose, of the central carbon intermediates ribose 5-phosphate (left), glucose 6-phosphate (middle), and alanine (right) in tumors treated with either DMSO (Veh) or vemurafenib (Vem). Data are normalized to the vehicle-treated group. Full labeling data are provided in Data S4. Values are mean ± SEM; n = 4–6 zebrafish per condition. (I) Fractional labeling, relative to serum M6 glucose, of gluconeogenesis-derived glucose (left) and alanine (right) in circulation and liver of vehicle-treated WT, vehicle-treated BRAF/p53, and vemurafenib-treated BRAF/p53 fish. Data are normalized to the vehicle-treated WT group. Values are mean ± SEM; n = 5–6 zebrafish per condition. Full labeling data are provided in Data S4. Statistically significant differences were assessed by a two-tailed paired t test (A–D, H, and I) or a Wilcoxon rank-sum test (E and F) and annotated as follows: ∗p < 0.05, ∗∗p < 0.01, ∗∗∗p < 0.001, or n.s. = not significant. R5-P, ribose 5-phosphate; G6-P, glucose 6-phosphate; Ala, alanine; Glc, glucose. |
Reprinted from Cell Metabolism, 33(7), Naser, F.J., Jackstadt, M.M., Fowle-Grider, R., Spalding, J.L., Cho, K., Stancliffe, E., Doonan, S.R., Kramer, E.T., Yao, L., Krasnick, B., Ding, L., Fields, R.C., Kaufman, C.K., Shriver, L.P., Johnson, S.L., Patti, G.J., Isotope tracing in adult zebrafish reveals alanine cycling between melanoma and liver, 1493-1504.e5, Copyright (2021) with permission from Elsevier. Full text @ Cell Metab.