
Figure 2
- ID
- ZDB-FIG-220219-77
- Publication
- Reuter et al., 2022 - Aging Activates the Immune System and Alters the Regenerative Capacity in the Zebrafish Heart
- Other Figures
- All Figure Page
- Back to All Figure Page
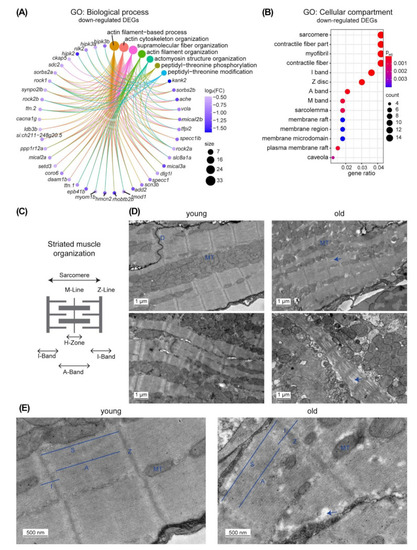
Expression of genes related to the actin filament is changed upon aging. (A) Circular plot illustrates the GO terms of the category “biological process” identified as enriched among 488 down regulated DEGs and the respective genes associated with these terms. The size of the GO term circle indicates the number of the genes and the color of the gene circle indicates the fold change (log2(FC)) in blue shades. Actin-related terms are prominent. (B) Dot plot indicates GO terms of the category “cellular compartments” that are enriched among the 488 down regulated DEGs. The size of the circle indicates the number of the genes, the color the adjusted p-value of the GO term analysis. Terms related to muscle structures are prominent. (C) Scheme of the striated muscle organization. (D) Electron microscopy pictures of the ventricle of 1-year-old (young) and 5-year-old (old) fish indicate changes in muscle organization in old. Scale bars: 1 µm. (E) Higher magnification picture of striated muscle organization in young and old. Scale bars: 500 nm. D: Desmosome; MT: Mitochondria; S: Sarcomere; I: I-Band; A: A-Band; Z: Z-Line. Arrows indicate to less dense muscle structures in old. |