
Fig 3
- ID
- ZDB-FIG-211116-19
- Publication
- Mendonca et al., 2021 - Origami: Single-cell 3D shape dynamics oriented along the apico-basal axis of folding epithelia from fluorescence microscopy data
- Other Figures
- All Figure Page
- Back to All Figure Page
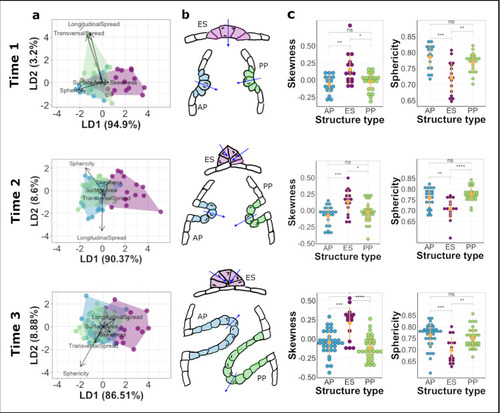
Rows represent each time point analysed. Data in blue represent cells from AP, green represent cells from PP and magenta represent ES. a. Linear discriminate analysis (LDA) biplots illustrate multivariate clustering of data—data from AP and PP show considerable overlap indicating similar shape signatures while data from ES show less overlap with the former. b. Schematic illustrations of cell shape signatures at the time points analysed showing cells in the ES having skew in the opposite direction to those in the projections and having less rounded shapes. Arrows indicate apico-basal polarity. c. Plots showing differences in skewness and sphericity between the structures at the time points analysed. Yellow dots with error lines represent mean and standard deviation for the data. |