
Fig. 6
- ID
- ZDB-FIG-211103-95
- Publication
- Ye et al., 2021 - Identification of in vivo Hox13-binding sites reveals an essential locus controlling zebrafish brachyury expression
- Other Figures
- All Figure Page
- Back to All Figure Page
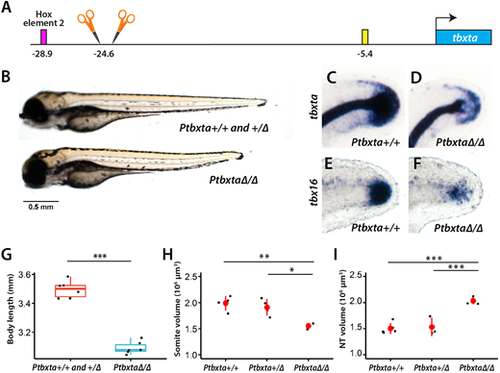
Embryos withHox element 1 deletion have a shorter body and reduced tbxta expression. (A) Two gRNAs flanking Hox element 1 were used to delete the element. (B,G) A cross of heterozygous fish yielded a mixture of embryos with either shorter or longer bodies. The longer-body embryos were genotyped to be either WT or heterozygous, whereas the shorter-body embryos were homozygous for the deletion. The total length of embryos from both genotypes was compared (G, n=6 for each genotype; ***P<0.001, one-way ANOVA). (C-F) Embryos were subjected to in situ hybridization with a tbxta or tbx16 probe and then subsequently genotyped. In embryos that are homozygous for the deletion of Hox element 1, there is reduced expression in NMps and tailbud mesoderm of both markers (D,F) compared with embryos without the deletion (C,E), but normal tbxta expression in the notochord. In the homozygous embryos, the posterior tip of the notochord is visible (D), whereas the posterior end of the embryo is hidden by tailbud tbxta expression in WT embryos (C). The tbxta and tbx16 embryos are at 24 and 28 hpf, respectively. The images show a lateral view, with the dorsal side at the top. (H) Homozygous embryos have defects in the formation of posterior somites, as shown by staining with the muscle antibody MF20 (see Fig. S6A for image). The volume of the posterior somites starting from somite 16 is shown (n=4 for WT and heterozygous, and n=3 for homozygous; *P<0.05, **P<0.01, Tukey HSD test; data are mean±s.d.). (I) Homozygous embryos show an enlarged neural tube (NT) as shown by sox2 FISH (see Fig. S6B for image). The volume of the posterior neural tube starting from the position of the 17th somite is shown (n=5 for WT, n=3 for heterozygous and n=4 for homozygous; ***P<0.001, Tukey HSD test; data are mean±s.d.). The box in the boxplot in G-I shows the upper, middle and lower quantiles of the data; the whiskers represent values outside the middle 50% data. |