
Fig. 2
- ID
- ZDB-FIG-211101-32
- Publication
- Zhang et al., 2021 - Selective and competitive functions of the AAR and UPR pathways in stress-induced angiogenesis
- Other Figures
- All Figure Page
- Back to All Figure Page
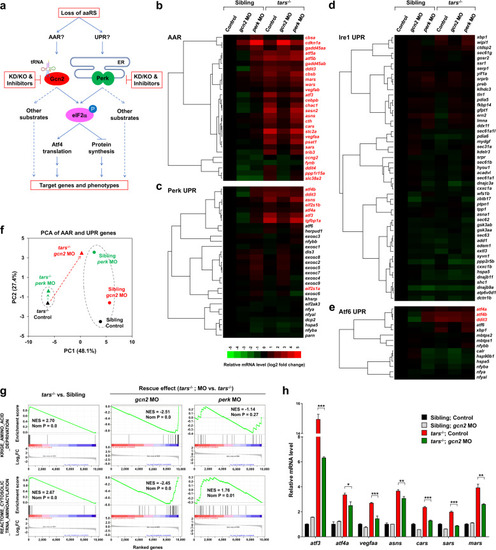
Differential and combinatorial regulation of the AAR- and UPR-associated genes by functional loss of Tars, Gcn2, or Perk.
a Schematic overview of study design. Both AAR and UPR may regulate the angiogenic phenotypes induced by deficiency of aminoacyl-tRNA synthetases (aaRSs). To distinguish between them, the proposed experimental strategies (in red boxes) were based on the tars mutant and the siblings; knockdown (KD), knockout (KO), and pharmacological inhibition of Gcn2 and Perk were used, and systematic gene expression profiling of the zebrafish embryos with various genotypes and treatments was performed. b–e Hierarchical clusters and heatmaps of the expression levels of the genes in the AAR gene set (b) and in the Perk-, Ire1-, and Atf6-mediated UPR gene sets (c–e). The data were produced by RNA-seq analyses of 36 hpf homozygous tars-mutated (tars−/−) embryos and their siblings from the same litters (sibling) that were treated with indicated morpholino (MO). The gene symbols written in red are known to be involved in AAR, even though some of them are also listed in the UPR gene sets (for further information and references, see Supplementary Tables S1-S4). The color bar indicates relative expression levels. Note that the upregulated genes in tars−/− mostly fall into the AAR category (written in red), whereas the UPR genes are largely unchanged, except for those shared in both pathways. f PCA of the AAR- and UPR-associated genes of the tars−/− (triangles) and siblings (circles) treated with gcn2 MO (red) or perk MO (green), compared with the control groups (black), respectively. Note that gcn2 MO, but not perk MO, significantly reversed the major component (PC1) score of tars−/−, whereas the perk MO only altered the PC2 score of the siblings but has a very subtle effect on the tars-mutants. g GSEA results showing strong enrichments of the AAR and tRNA aminoacylation genes in the tars−/− embryos, which can be reversed by gcn2 MO but not perk MO. h RT-qPCR analysis of the representative genes that are activated in the tars−/− embryos and are downregulated by gcn2 MO. Data are presented as means ± SD of triplicate reactions. ***P < 0.001; **P < 0.01; *P < 0.05. The P values for the increased expression of all these genes in tars−/− relative to the siblings are less than 0.001 (not shown). |
| Genes: | |
|---|---|
| Fish: | |
| Knockdown Reagent: | |
| Anatomical Term: | |
| Stage: | Prim-25 |
| Fish: | |
|---|---|
| Knockdown Reagent: | |
| Observed In: | |
| Stage: | Prim-25 |