
Figure 1
- ID
- ZDB-FIG-211029-135
- Publication
- Lam et al., 2021 - Systems Analysis Reveals Ageing-Related Perturbations in Retinoids and Sex Hormones in Alzheimer's and Parkinson's Diseases
- Other Figures
- All Figure Page
- Back to All Figure Page
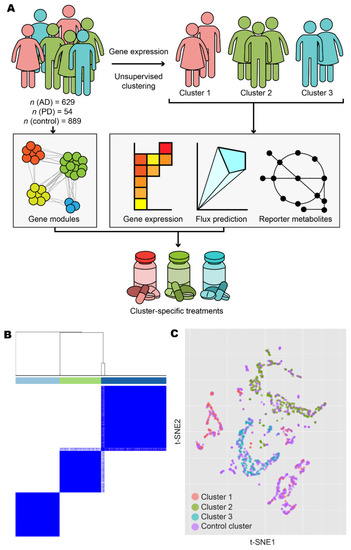
Overview and exploratory data analysis. (A) Workflow for the analysis of human AD and PD samples. (B) AD and PD samples were clustered into k clusters without supervision on the basis of normalised expression counts. Results are shown for k = 3 and 1000 bootstrap replicates. Colour bars indicate cluster identity for each sample. For 2 ≤ k ≤ 7, refer to Figure S1. (C) Normalised expression data from AD, PD, and control samples were projected onto 2-D space using t-distributed stochastic neighbour embedding (t-SNE). Points are coloured according to cluster assignment by unsupervised clustering. For further data visualisation, refer to Figure S2. |