|
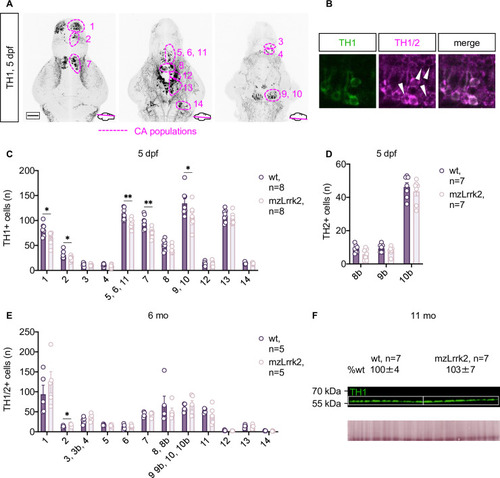
Population-specific defects in the CA system of mzLrrk2 larvae.(A) The zebrafish CA cell populations in the rostro-caudal axis from the olfactory bulb to the locus cæruleus as revealed by tyrosine hydroxylase 1 (TH1) IHC at 5 dpf. Pop. 1: olfactory bulb; pop. 2: telencephalic complex; pop. 3: preoptic area, pars anterior; pop. 4: preoptic area, pars posterior; pop. 5, 6, 11: diencephalic complex; pop. 7: pretectal area; pop. 8: paraventricular organ, pars anterior; pop. 9: paraventricular organ, pars intermedia; pop. 10: paraventricular organ, pars posterior; pop. 12: posterior tuberal nucleus/posterior tuberculum; pop. 13: hypothalamic complex; pop. 14: locus cæruleus. (B) Combination of the anti-TH1 antibody with the pan-TH antibody allows the identification of TH2+ cells (white arrowheads) by exclusion. TH2+ cells are found within the TH1 pop. 8, 9, and 10 in the paraventricular organ, thereby constituting the TH2 pop. 8b, 9b, 10b. (C and D) Quantification of TH1+ (C) and TH2+ cells (D) revealed defects in distinct CA cell populations in the brain of mzLrrk2 larvae (5 dpf). Plot represents means ± s.e.m. Statistical analyses: (C: pop. 2–14 and D) two-tailed Student’s t-test; (C: pop. 1) two-tailed Mann-Whitney’s U-test. (E) Quantification of TH1/2+ cells in the adult brain (6 mo) revealed absence of CA cell defects in mzLrrk2 fish. Plot represents means ± s.e.m. Statistical analyses: (E: pop.1, E: pop. 3–11, E: pop. 13 and E: pop. 14) two-tailed Student’s t-test; (E: pop. 2 and E: pop. 12) two-tailed Mann-Whitney’s U-test. (F) Quantification of TH1 protein levels in 11-mo brains shows intact CA system in adult fish; total protein stain as loading control is shown. Protein levels are reported as means ± s.e.m. relative to wt levels (%). Statistical analysis: two-tailed Student’s t-test.
|