
Figure 4
- ID
- ZDB-FIG-210902-273
- Publication
- Nowik et al., 2021 - The Role of Galanin during Bacterial Infection in Larval Zebrafish
- Other Figures
- All Figure Page
- Back to All Figure Page
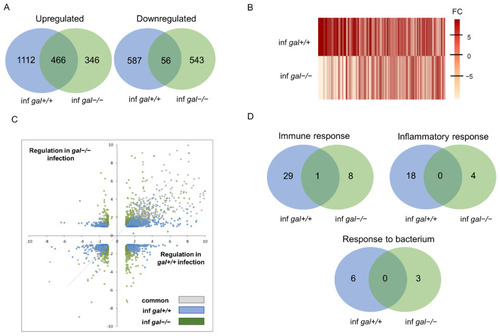
Transcriptome analysis by RNA-seq showing modulation of infection-induced gene regulation by galanin mutation. (A) Venn diagram showing overlaps between clusters of genes significantly upregulated or downregulated by infection of gal+/+ and gal−/− mutant larvae; (B) heat map displaying the normalized fold changes of transcripts that reached statistical significance as differentially expressed in infected gal+/+ and infected gal−/− zebrafish larvae; (C) scatter plot showing the effect of galanin deficiency on gene expression. For all genes showing significant regulation upon infection (blue and gray dots) or the combined infection in the mutant (gray dots). Gray dots represent the overlap between control infection and mutant infection. The gray line indicates the point at which galanin knockout treatment does not alter infection-induced gene regulation; (D) GO analysis for upregulated genes in biological processes. Paired analysis was per-formed using DESeq2 by comparing each group to each non-infected group. Significantly regulated genes were selected by using a p.adj < 0.05 and |FoldChange| > 1.5 cutoff. |