|
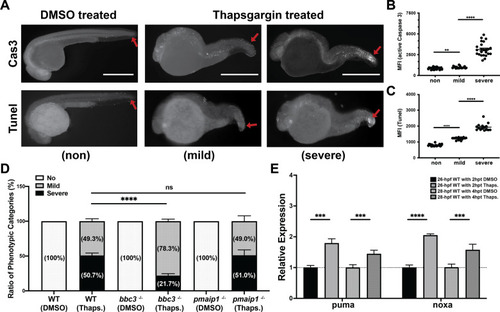
Loss of puma partially rescues Thapsigargin (Thaps.)-induced apoptosis at early embryonic stage.A Anti-active Caspase-3 (The Upper Panel) and TUNEL (The Lower Panel) staining on 28 hpf (4 h post treatment) wild-type zebrafish embryos with DMSO alone or with DMSO plus 5 μM Thaps. Representative figures showing phenotypic categories of the apoptotic severity. Arrows points out apoptotic area in tail region in WT embryos with DMSO alone or with DMSO plus 5 μM Thaps for 4 h. Scale bar, 1000 μM. B Quantification of the fluorescence intensity of tail region of DMSO-treated and Thaps. treated embryos in mild and severe categories with anti-active Caspase-3 staining. Each dot represents mean fluorescence intensity (MFI) of the tail region of individual embryos from three independent experiments. Bars represent mean ± SEM. **p < 0.01.****p < 0.0001. C Quantification of the fluorescence intensity of tail region of DMSO-treated and Thaps. treated embryos in mild and severe categories for TUNEL staining. Each dot represents mean fluorescence intensity (MFI) of the tail region of individual embryos from two independent experiments. Bars represent mean ± SEM. ****p < 0.0001. D Loss of puma (not noxa) partially rescued Thaps. induced apoptosis at 24 hpf. Ratio of phenotypic categories in wild type, bbc3−/− and pmaip1−/− zebrafish embryos. n = 7 (wild type and bbc3−/−) and n = 4 (pmaip1−/−) from pooled embryos per sample. The total number of Thaps. treated embryos: wild type > 1000, bbc3−/− > 900 and pmaip1−/− > 550. Bars represent mean ± SEM. ****p < 0.0001. E qRT-PCR analysis of puma and noxa after DMSO or 5 μM Thapsigargin treatment in 24 hpf zebrafish embryos across time (2hpt and 4hpt). Expression levels were normalized to GAPDH. n = 5 (26-hpf WT with or w/o 2 h post Thaps. treatment) and n = 9 (28-hpf WT with or w/o 4 h post Thaps. treatment) from ~30 pooled embryos per sample. Bars represent mean ± SEM. ***p < 0.001; ****p < 0.0001.
|