
Figure 2
- ID
- ZDB-FIG-210714-24
- Publication
- Lord et al., 2021 - The pattern of Nodal morphogen signaling is shaped by co-receptor expression
- Other Figures
- All Figure Page
- Back to All Figure Page
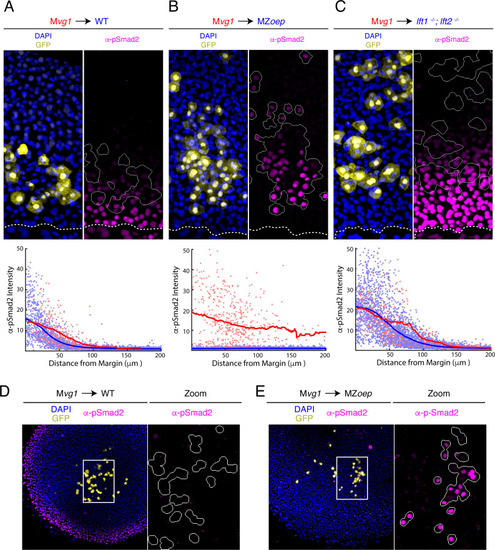
(A-C) Sensor cell assay and gradient quantifications in (A) wild type, (B) MZoep, and (C) lft1-/-;lft2-/- embryos. Mvg1 sensor cells were marked with GFP (yellow) and transplanted to the margin of host embryos. Nodal signaling activity is measured by α-pSmad2 immunostaining (magenta). YSL boundaries are marked with dashed curves and sensor cell boundaries are outlined in solid white in all α-pSmad2 panels. Gradient quantifications for each experiment are below images; host and sensor cell staining intensities are plotted as blue and red points, respectively. Sliding window averages are plotted as solid curves. Plots for wild type, MZoep, and lft1-/-;lft2-/- backgrounds were derived from 8, 10, and 8 replicate embryos, respectively. Decay parameters for single-exponential model fits (±95% confidence bounds) are −0.02 ± 0.004 μm−1,–0.007 ± 0.002 μm−1 and −0.013 ± 0.002 μm−1 for wild-type, MZoep and lft1-/-;lft2-/ hosts, respectively. (D) Left panel; Mvg1 sensor cells (yellow) were transplanted directly to the animal pole of a wild-type host. The endogenous Nodal signaling gradient is visible at the embryonic margin (magenta). White box highlights region expanded for detail view in right panel. Right panel; Nodal signaling activity is absent in both host and sensor cells. (E) Left panel; Mvg1 sensor cells (yellow) were transplanted to the animal pole of an MZoep embryo. Nodal signaling is absent at the embryonic margin. White box highlights region expanded in the right panel. Right; sensor cells detect Nodal at the animal pole (magenta). |