|
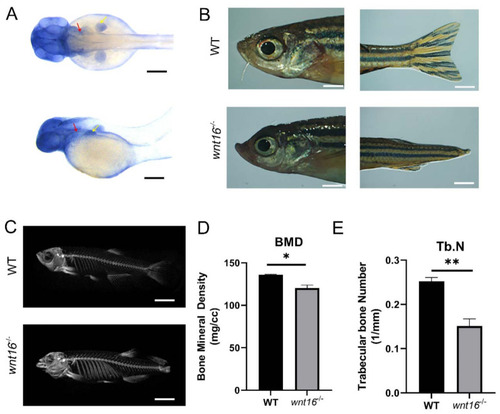
Images of zebrafish generated by WISH, light microscopy, and micro-CT and skeletal statistical analysis. (A) Images of whole-mount in situ hybridisation with wnt16 mRNA probes in WT larvae at 48 hpf. Colour intensity is proportional to the expression level of wnt16 gene. Arrowheads indicate relevant domains of expression. Yellow, pectoral fin bud (pfb); red, operculum (op). (B) Representatives of adult WT and wnt16−/− mutant zebrafish are shown. Apparent abnormality was observed in the head and tail of wnt16−/− mutant zebrafish. (C) Micro-CT scanning of WT and wnt16−/− mutant zebrafish skeleton. Obvious abnormality was observed in the mandible and spine of wnt16−/− mutant zebrafish. (D,E) Statistical analysis of BMD (D) and Tb.N (E) in WT and wnt16−/− zebrafish. Note that BMD and Tb.N value decreased in the wnt16−/− group. The results are represented as means ± SEM, * p < 0.05, ** p < 0.01. Scale bar: 150 μm (A); 2 mm (B); 6 mm (C).
|