
Fig. 4
- ID
- ZDB-FIG-210710-9
- Publication
- Noy-Lotan et al., 2021 - Cdan1 Is Essential for Primitive Erythropoiesis
- Other Figures
- All Figure Page
- Back to All Figure Page
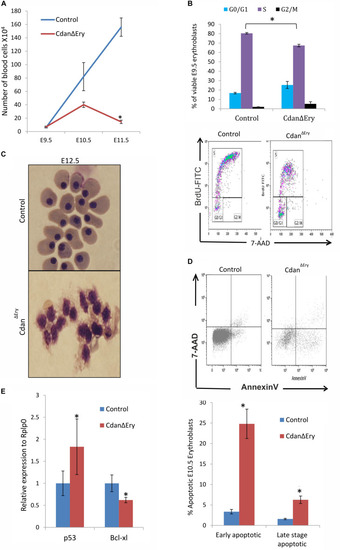
Cdan1 depletion impairs cell cycle progression and increases cell death. (A) Number of circulating primitive erythroid cells collected from E9.5 to E11.5 control and CdanΔEry embryos. Values represent mean ± Standard error. CdanΔEry: n = 3; Control: n = 9. *p < 0.002 compared to controls. (B) CdanΔEry E9.5 erythroblasts show aberrant G1-to-S progression. The percentage of cells in G0/G1, S and G2/M phases of the cell cycle in wild-type (control) and CdanΔEry E9.5 erythroblasts gated for the CD71+/Ter119+ population. CdanΔEry n = 3; control n = 12. Error bars indicate standard error. *p < 0.02 compared to wild-type. (C) Morphology of E12.5 CdanΔEry circulating erythroblasts, compared to littermate controls. (D) E10.5 peripheral blood cells were gated for CD71+/Ter119+ erythroblasts, and analyzed for AnnexinV/7AAD staining to assess for apoptosis (Representative flow plots are shown in upper panel). Early apoptotic cells are AnnexinV-positive/7-AAD-negative; Late apoptotic cells are double positive. Data presented as mean ± SEM (n = 3-4 for each genotype). *p < 0.005. (E) Cdan1 ablation decreases Bcl-xl expression and increases p53 levels. qRT-PCR was performed with RNA extracted from peripheral blood cells at E11.5 and normalized to Rplp0. Relative expression data are presented as mean ± SEM (n = 4–6 for each genotype). Student’s t-test was applied for statistical analysis. Asterisks indicate significant difference from the Control. *p < 0.05. |