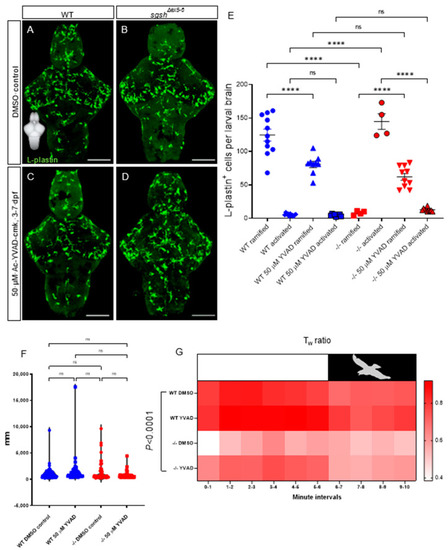
CNS neuroinflammation in sgshΔex5−6 larvae is corrected by continuous pharmacological Caspase-1 blockade. (A,B) L-plastin immunostaining of microglia in 7 dpf wild type and sgshΔex5−6 brains from larvae continuously treated from 3–7 dpf with 0.1% DMSO as control. (C,D) L-plastin immunostaining of microglia in 7 dpf wild type and sgshΔex5−6 brains from larvae continuously treated from 3–7 dpf with 50 µM Ac-YVAD-cmk Caspase-1 inhibitor. Scale bars 50 µm. (E) Quantification of L-plastin+ microglial morphology and abundance following treatment with either 50 µM Ac-YVAD-cmk or 0.1% DMSO in wild type and sgshΔex5−6 larval brains at 7 dpf. Each point represents a single brain. Data presented as mean ± SEM and tested by ordinary one-way ANOVA with Tukey’s multiple comparisons test; **** p < 0.0001, n.s. p > 0.05. (F) Neither YVAD nor DMSO exposure significantly alters basal movement (cumulative distance travelled, mm, in constant illumination) in either wild type or sgshΔex5−6 7 dpf larvae. Data presented as mean ± SEM and tested by one-way ANOVA with Tukey’s multiple comparisons test; n.s. p > 0.05. (G) Chronic YVAD administration to sgshΔex5−6 partially rescues impaired thigmotaxis behaviours under standard conditions (white boxed region, representing constant levels of light), but does not attenuate the impaired escape response in response to sudden threat conditions (black boxed region, representing sudden switching off of light and resulting darkness). Data presented as heat map reflecting relative mean Tw (wall preference ratio) metric at specific time point of sample recording. Data were analysed by two-way ANOVA with stacked matching, where sphericity of variances was not assumed and α = 0.05. The treatment condition was found to represent 47.43% of variation in the dataset, p < 0.0001. Each group represents mean values of 18 replicate trials per each condition.
|
