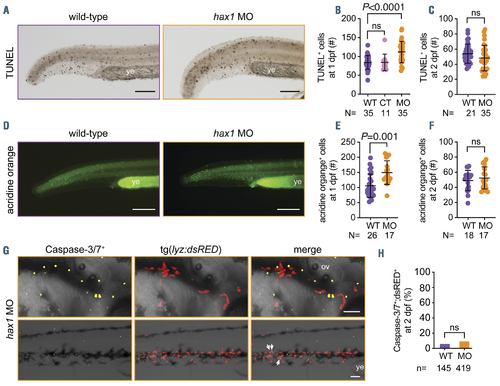
Enhanced apoptosis by hax1 knockdown. (A) Representative images of TUNEL-positive cells in wild-type (WT) and hax1 morphants (MO) at 1 day post-fertilization (dpf). (B, C) Quantitative numbers of TUNEL-positive cells in the trunk region at 1 dpf (B) and 2 dpf (C). Note injection of control (CT) morpholino did not significantly increase the number of TUNEL-positive cells. (D) Representative images of acridine orange-stained cells in WT and hax1 MO at 1 dpf. (E, F) Quantitative numbers of acridine orange-stained cells in the trunk region at 1 dpf (E) and 2 dpf (F). (G) Representative images from the head (top panel) and trunk region (bottom panel) of the tg(lyz:dsRED) embryos injected with hax1 MO showing cells stained with caspase-3/7 reporter (yellow) and neutrophils (red) at 2 dpf. (H) Frequency of caspase-3/7 and dsRED double positive cells in WT and hax1 morphants. n indicates number of dsRED+ cells counted from three wild-type embryos (WT) and 10 morphants (MO) at 2 dpf. Each dot in B, C, E and F represents an individual embryo. Data are means } standard deviation. Scale bars: 100 mm (A, D) and 50 mm (G). ov: otic vesicle; ye: yolk extension.
|
