
FIGURE
Figure 3
- ID
- ZDB-FIG-210409-152
- Publication
- Kim et al., 2021 - Comparative Proteome Research in a Zebrafish Model for Vanishing White Matter Disease
- Other Figures
- All Figure Page
- Back to All Figure Page
Figure 3
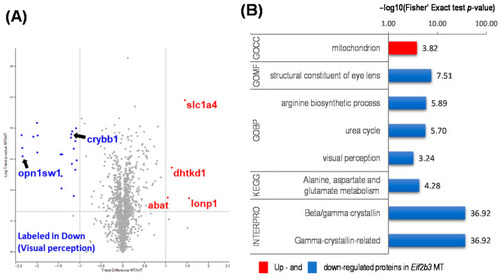
Functional annotation of differentially expressed proteins (DEP) in the WT and eif2b3 knockout. (A) Distribution of the 1352 quantified proteins (upregulated, red filled circles; downregulated, blue filled circles) in eif2b3−/− compared to the WT, according to one-sample t-tests and fold change (p < 0.05). (B) DAVID-generated GO enrichment and KEGG pathway analysis of DEPs. The–log of Fisher’s exact test was used to represent the enrichment index. GOBP: Gene Ontology Biological Process, CC: cellular component, MF: molecular function, KEGG: Kyoto Encyclopedia of Genes and Genomes. |
Expression Data
Expression Detail
Antibody Labeling
Phenotype Data
Phenotype Detail
Acknowledgments
This image is the copyrighted work of the attributed author or publisher, and
ZFIN has permission only to display this image to its users.
Additional permissions should be obtained from the applicable author or publisher of the image.
Full text @ Int. J. Mol. Sci.